
Introduction
Welcome to the HeRAMS User Guide. This user guide was designed for users of the HeRAMS platform. It provides step-by-step instructions on how to register and access the HeRAMS platform as well as a brief overview of key components of the platform, including detailed information on how to explore the available data using the interactive dashboards. Data managers can find additional information on how to edit data in the Contribute data section. For more advanced topics related to user management and project administration, please consult the HeRAMS administration section.
It should be noted that this guide only addresses issues related to the HeRAMS platform. For general information on the HeRAMS approach and for technical guidance please consult the official WHO HeRAMS webpage or contact the HeRAMS support team.
Getting started
This chapter is intended for new users of the HeRAMS platform. It covers issues related to registering and accessing the platform as well as managing your user profile. To help you navigate the platform on your own, the last part of this chapter provides an overview of recurring icons used across the platform and introduces breadcrumbs as an efficient way to navigate the platform.
Creating a User Account
- To register as a new user, open the link herams.org in your browser.
Tip
It is strongly recommended to either user FireFox or Chrome.
- In the lower half of the screen you should see an option to register as a new user. Enter your email address and click the
 button.
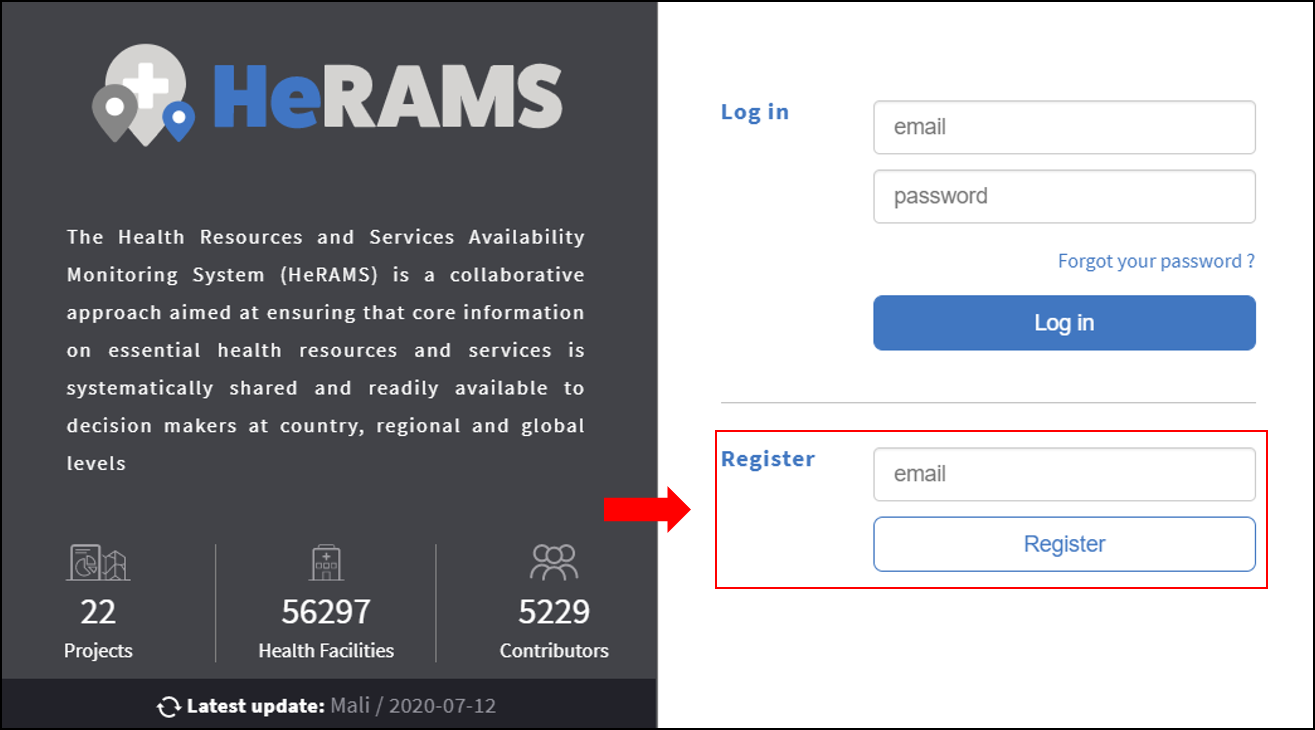
- A confirmation email will be sent to your email. Confirm your registration by clicking the link in the email.
Tip
If you don’t receive a confirmation email within a few minutes, check your spam folder.
- A new tab will open prompting you to enter your name and password. Click the
 button to finalize your registration.
Note
If you are not automatically logged-in, please follow the steps below to login as an existing user.
Logging in
Note
New users without an existing account, will have to register before being able to login to the HeRAMS platform. To create a user account, follow the instructions here.
- Open the link herams.org in your browser.
- Enter your email address and password in the designated fields in the top half of the page and click the
 button.

Tip
It is strongly recommended to use either FireFox or Chrome.
Logging out
To logout click the  button in the top right corner of the screen.
Reset password
In case you forgot your password, the instructions below will guide you through the steps to reset your password.
- Open the link herams.org in your browser.
- On the sign-in page, click the Forgot your password link.
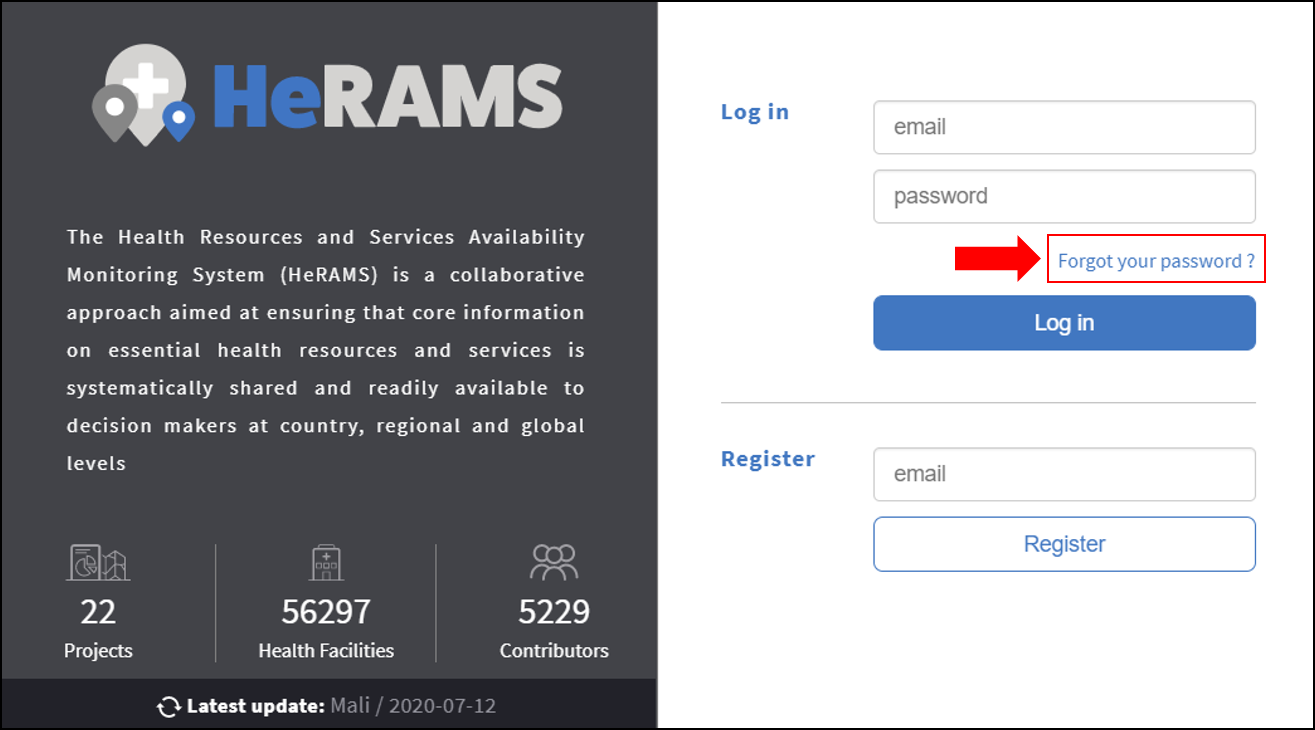
- Enter your email address in the designated field and click the
 button.
 - You will receive an email with a password reset link. Click the link in the email to open the password reset page.
Note
If you did not receive this email within a few minutes, check your spam folder.
- On the page that opens, enter your new password.
- Click the
 button to confirm your new password.
 - You have now successfully changed your password. To access the HeRAMS platform, return to the sign-in page and enter your credentials.
Update your User Profile
Each user has a profile associated with their account. This permits you to change your user name, email address, or password without requiring additional support.
- To update your user profile, click the
 icon in the top right corner of the page.
 - This opens your user profile and allows you to change your personal information.
Change Password
- To change your password, open your user profile as explained above.
- In the pop-up window that opens, select the Password tab.
- You should now be able to change your email address and enter a new password.
- Make sure to click the
 button to confirm your changes.
 - To return to the main page, click the
 icon in the top right corner.
Change Language Preference
The HeRAMS platform is available in multiple languages. Unless specified otherwise, the language will be automatically selected based on your browser language. For users having a browser language that is not supported by HeRAMS, the language will default to English. To manually adjust your language preference, follow the steps below.
- To change your language preference, open your user profile as explained above.
- In the pop-up window that opens, navigate to the Profile tab.
- Change the drop-down list to the desired language and click the
 button.
Note
HeRAMS will remember your language preferences next time you log in. If you would like to change them, you must return to this page and update your user profile.
Change Email Address
- To change your e-mail address, open your user profile as explained above.
- Open the Email tab and enter the new email address you would like to use for your HeRAMS account.
- Click the
 button. This will send a confirmation email to your new email address.
 - Click the link in the confirmation email to validate your new email address.
Icons and their Meaning
This section aims to provide an overview of key icons used across the platform and explains their meanings.
 Delete: Deletes a specific item or record.
 Edit: Opens the data edit interface. More information on data editing and updating is available here.
- Home: The home button takes you back to the world map (home screen).
 Settings: Use this button to access the HeRAMS admin interface. Additional information on the HeRAMS admin interface is available in the HeRAMS administration chapter.
 Favorites: This allows you to create a personal list of favorite workspaces, accessible directly from the world map. Further information on how to add workspaces to your Favorites is available in the Contribute data chapter.
- User profile: Opens your user profile and allows you to modify your personal information (e.g. language preference, email address, and password). See here for further details.
 User guide: Opens the HeRAMS User Guide.
 View: Grants you view access to a specific item or record.
Breadcrumbs
Across the platform, breadcrumb trails are shown on top of every page. They intend to help you navigate the platform more effectively and provide a simple way to access previous pages. In the example below, clicking on Nigeria in the breadcrumb trail allows you to return to the dashboard overview page from any of the sub-pages.

View a Project
This chapter provides an introduction to real-time analytics available in the HeRAMS platform. For each project, a high-level overview on key indicators such as the number of health facilities assessed, overall functionality, and service availability is available. Interactive dashboards provide additional insights into individual projects and empower users to produce in-depth analyses for specific areas and indicators of interest.
Project Overview
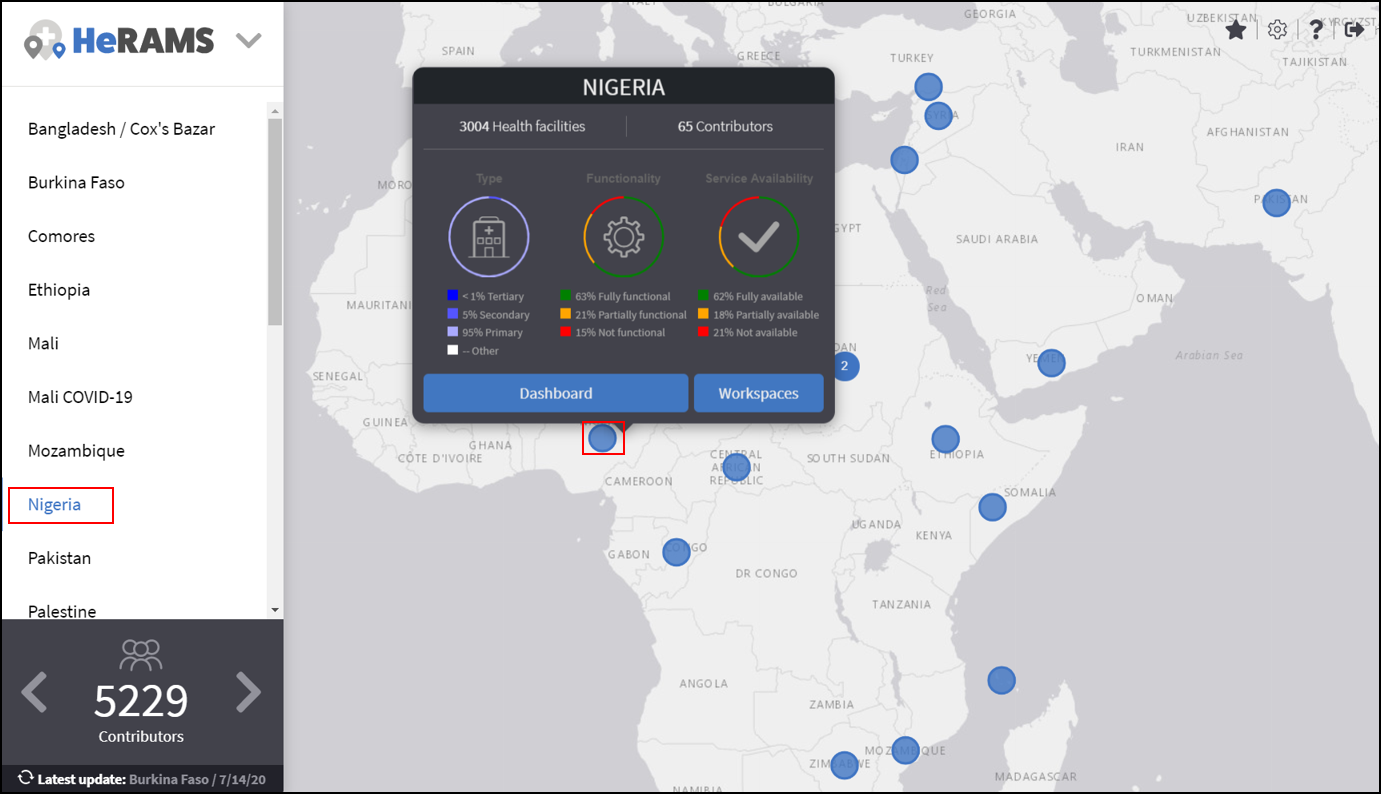
After logging in, you will see a world map with several blue dots. Each of these dots represents a HeRAMS project. You can also see the list of all available projects in the navigation pane on the left. In addition, a brief summary of the number of projects available in HeRAMS, the total number of contributors, and health facilities is shown in the bottom left corner.
- To learn more about a project, either click the blue dot on the world map or select the project from the navigation pane on the left.
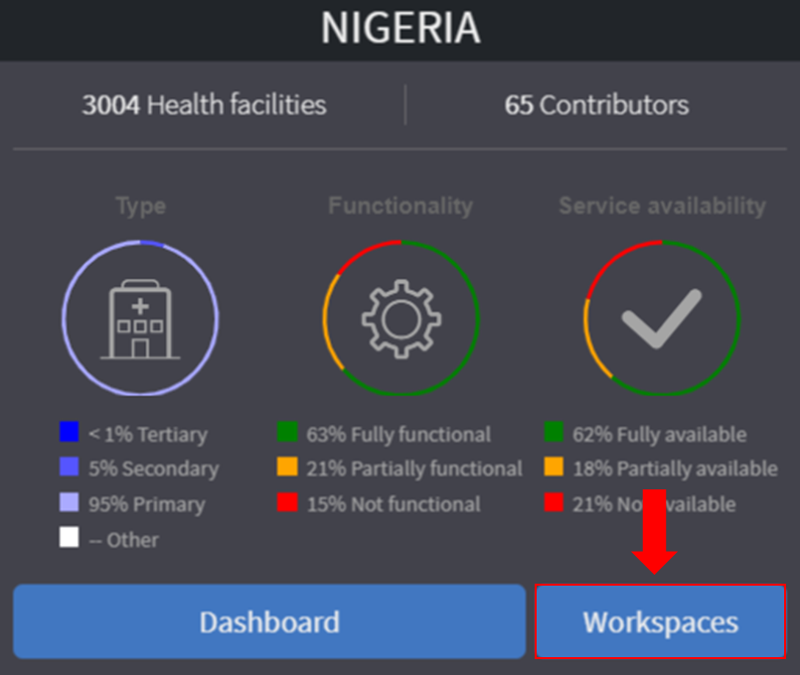
- You should now see a pop-up window displaying an overview of the selected project. In the upper part of the pop-up, you can see the project name, the number of health facilities assessed as well as the number of contributors. The lower half of the pop-up window displays a brief summary of the distribution of health facility types, their functionality, and service availability.
- For further details, click the
 button. This will open the project dashboard.
Tip
Access to the project dashboards may be restricted to selected users. If you would like to be granted access to a project dashboard, please contact your country focal point or send an email to herams@who.int specifying your function and role as well as a brief explanation of why you would like to access the dashboard.
Project dashboard
Each project in HeRAMS has a custom interactive dashboard providing an instant and in-depth analysis based on the available data.
- To view a project dashboard, open the project summary by selecting your project from the navigation pane on the left. Alternatively, you can open the project summary by clicking the corresponding blue dot on the world map.
- In the pop-up window, click the button. This will open the interactive dashboard.
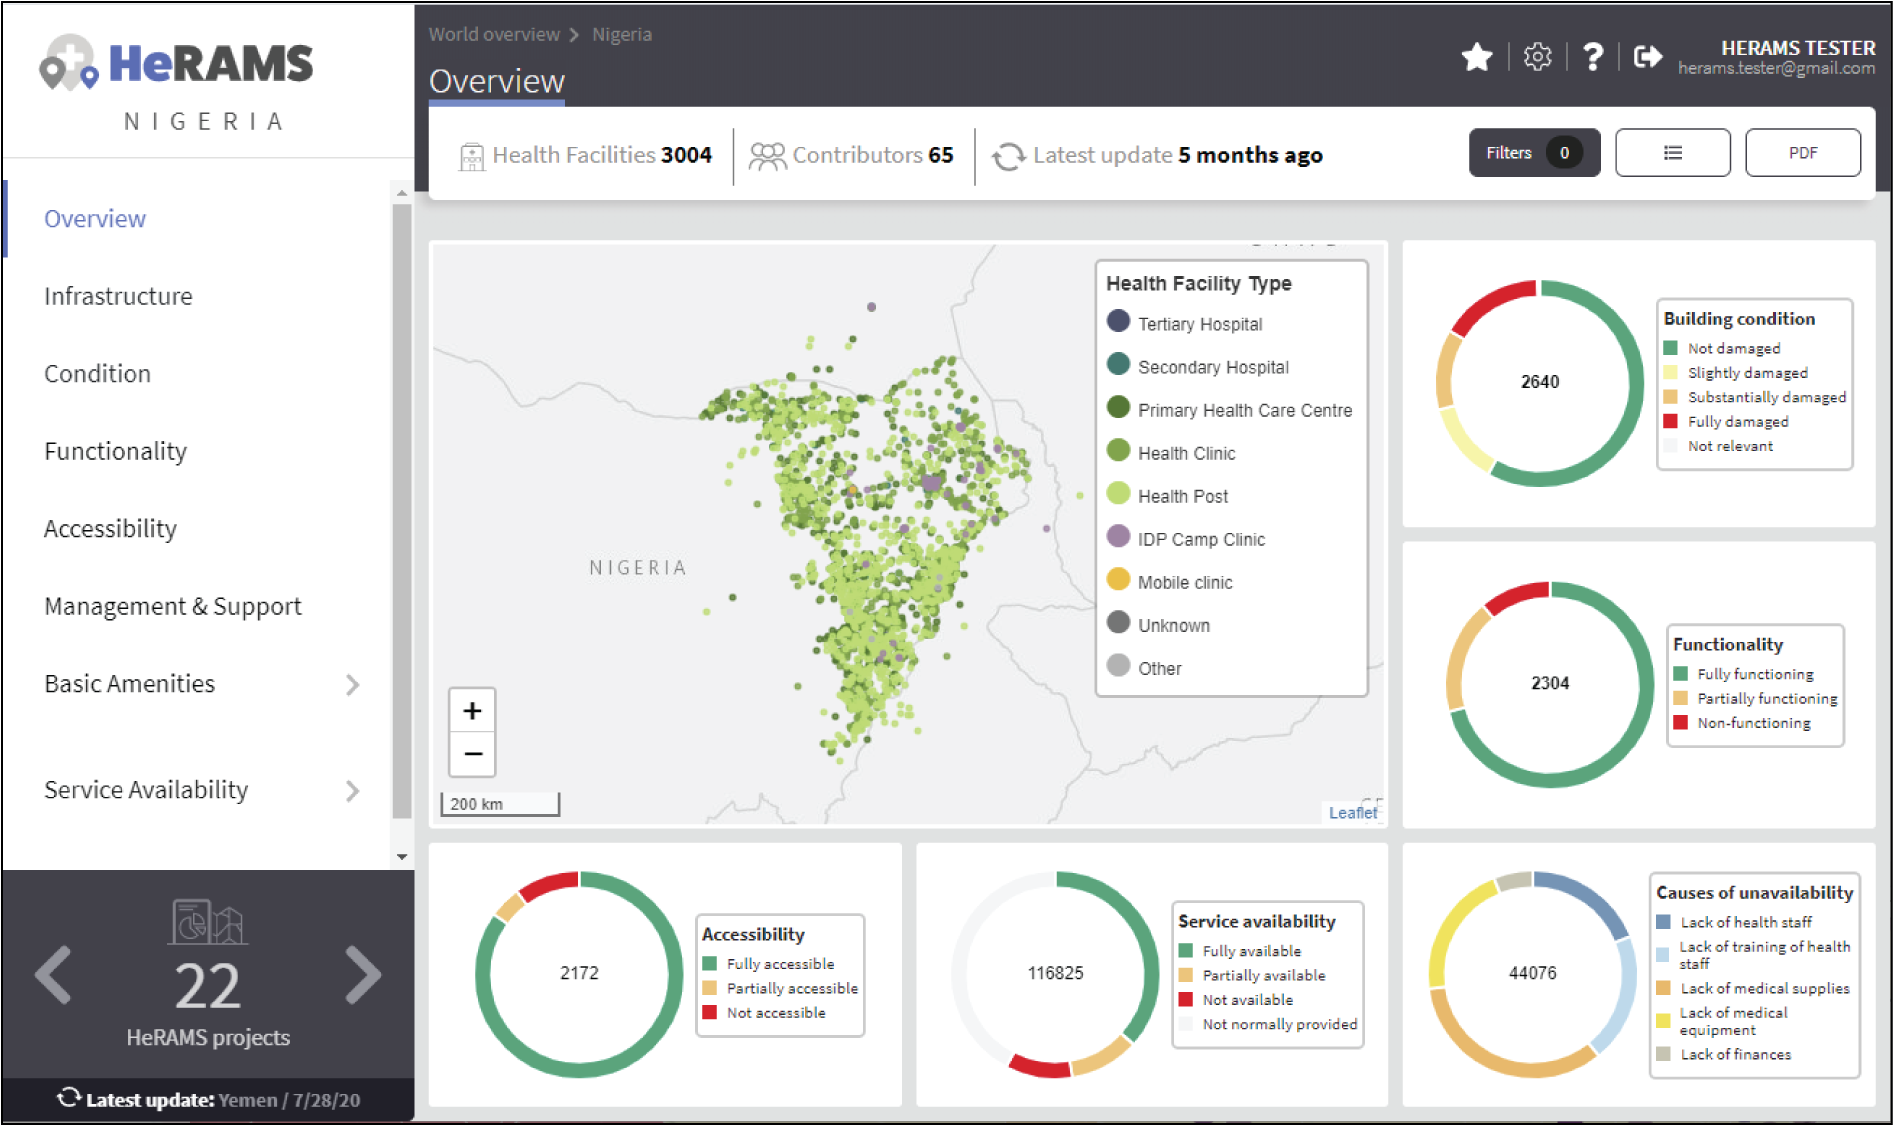
- You should now see a page similar to the one shown below. In the navigation pane on the left, you will find a list of all available pages.
- To open a page, click the page name in the navigation pane.
Tip
Some pages may contain a sub-page, indicated by a ![]() icon next to the page’s name.
icon next to the page’s name.
Tip
If you hover with your mouse over a point on a map or a chart, a small pop-up message will appear, displaying additional details.
The animation below shows the dashboards in action.
Customizing a dashboard
This section provides a few tips and tricks on how to customize the dashboard by applying filters and alter some of the default display options.
Apply filters
Data on the dashboard can be filtered. This allows you to scrutinize the data subsets that are of interest to you.
Note
Filtering is not persistent and only visible during your current session.
- In the top right corner of the dashboard, click the
 button.
 - You should now see the filtering setting page. Use the drop-down list to select your filter criteria. Repeat this process until you have added all the desired filter criteria.
Note
If you apply multiple search criteria, only results that contain all terms will be shown.
Tip
You can limit the number of fields displayed using the search field on the top of the page.
- Click the
 button to activate your filter.
 - To remove the filters, return to the Filter pages and click the
 button.
Map Zoom Level and Focus Area
You can adjust the zoom level of a map by using the scroll button on your mouse. To change the focus area of a map, position your mouse in the map element. Click the map (hold) and drag the map in the desired direction. This will move the map focus area.
Remove a Category from Charts or Maps
By clicking the icons in the legend, you can remove a category from a chart or map. To add it again, simply click the circle again.
Reorder map layers
Depending on the zoom level applied to a map, it may happen that several points lie on top of each other, hiding some facilities. To bring a specific category to the front, uncheck the category in the legend. This will remove the category from the map. If you add the category again (click the now empty circle), the category will be added on top of the other points.
Exporting a dashboard
Dashboards can be printed or exported as PDF documents.
Note
The export will include any applied filters.
- To export a dashboard, open the desired dashboard as explained here.
- Click the
 icon in the top right corner of your screen.
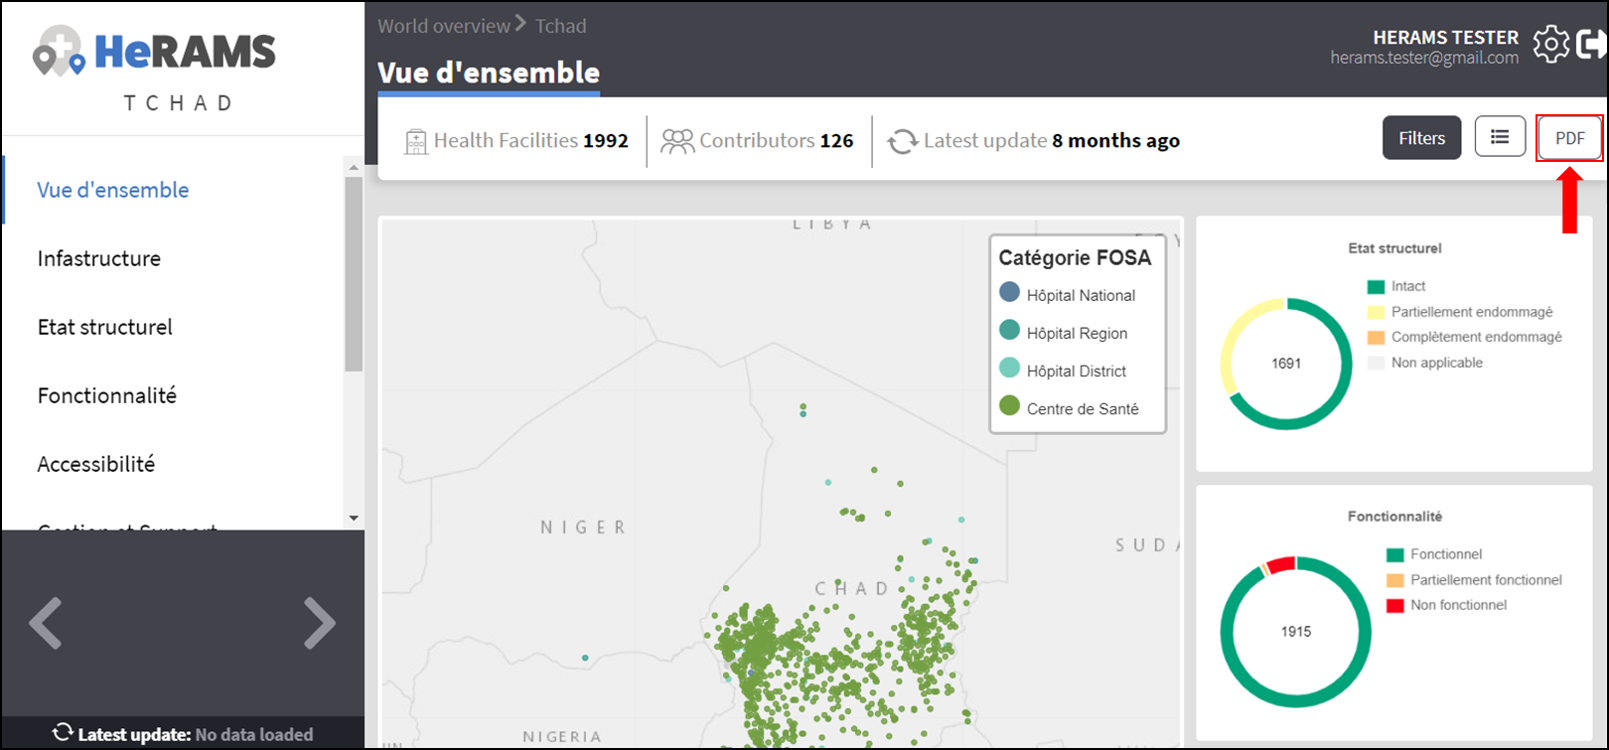
- This will open a new tab containing a printable version of the dashboard. Click CTRL + P to print the dashboard or save it as a pdf.
Default dashboard pages
The below section provides an overview of the standard pages available in a dashboard. Each page refers to a HeRAMS standard information pillar.
Note
The order and the content of dashboards are customized individually based on each project’s need. Your dashboard might, therefore, be substantially different from the example pages displayed below.
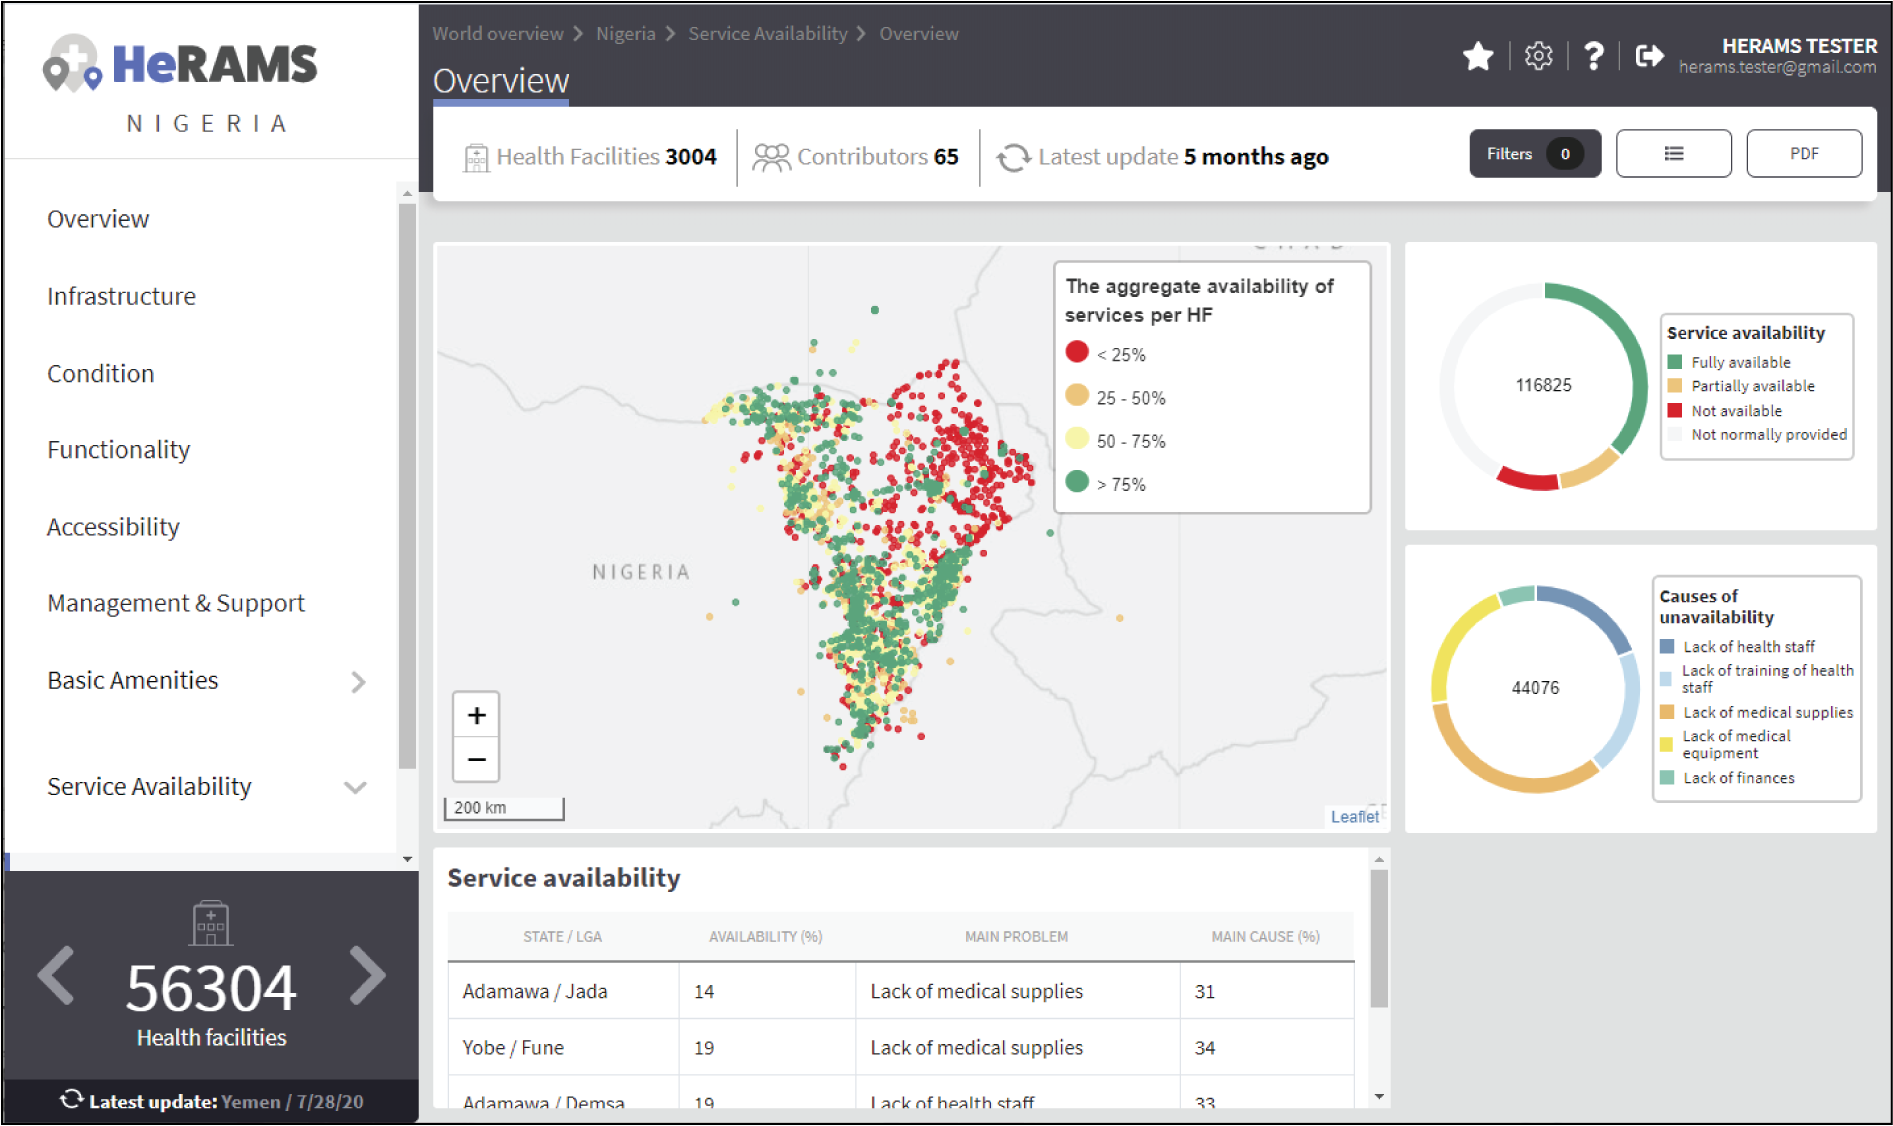
Overview
The Overview page provides a summary, in form of:
- a map to spot the distribution and number of health facilities by level of care (i.e. primary, secondary and tertiary health care facilities); and
- donut charts to summarize different indicators, such as level of damage, functionality status, accessibility, and service availability in the assessed health facility.
Note
The service availability indicator is country-specific. Thus, direct comparisons from one country to another should be avoided.
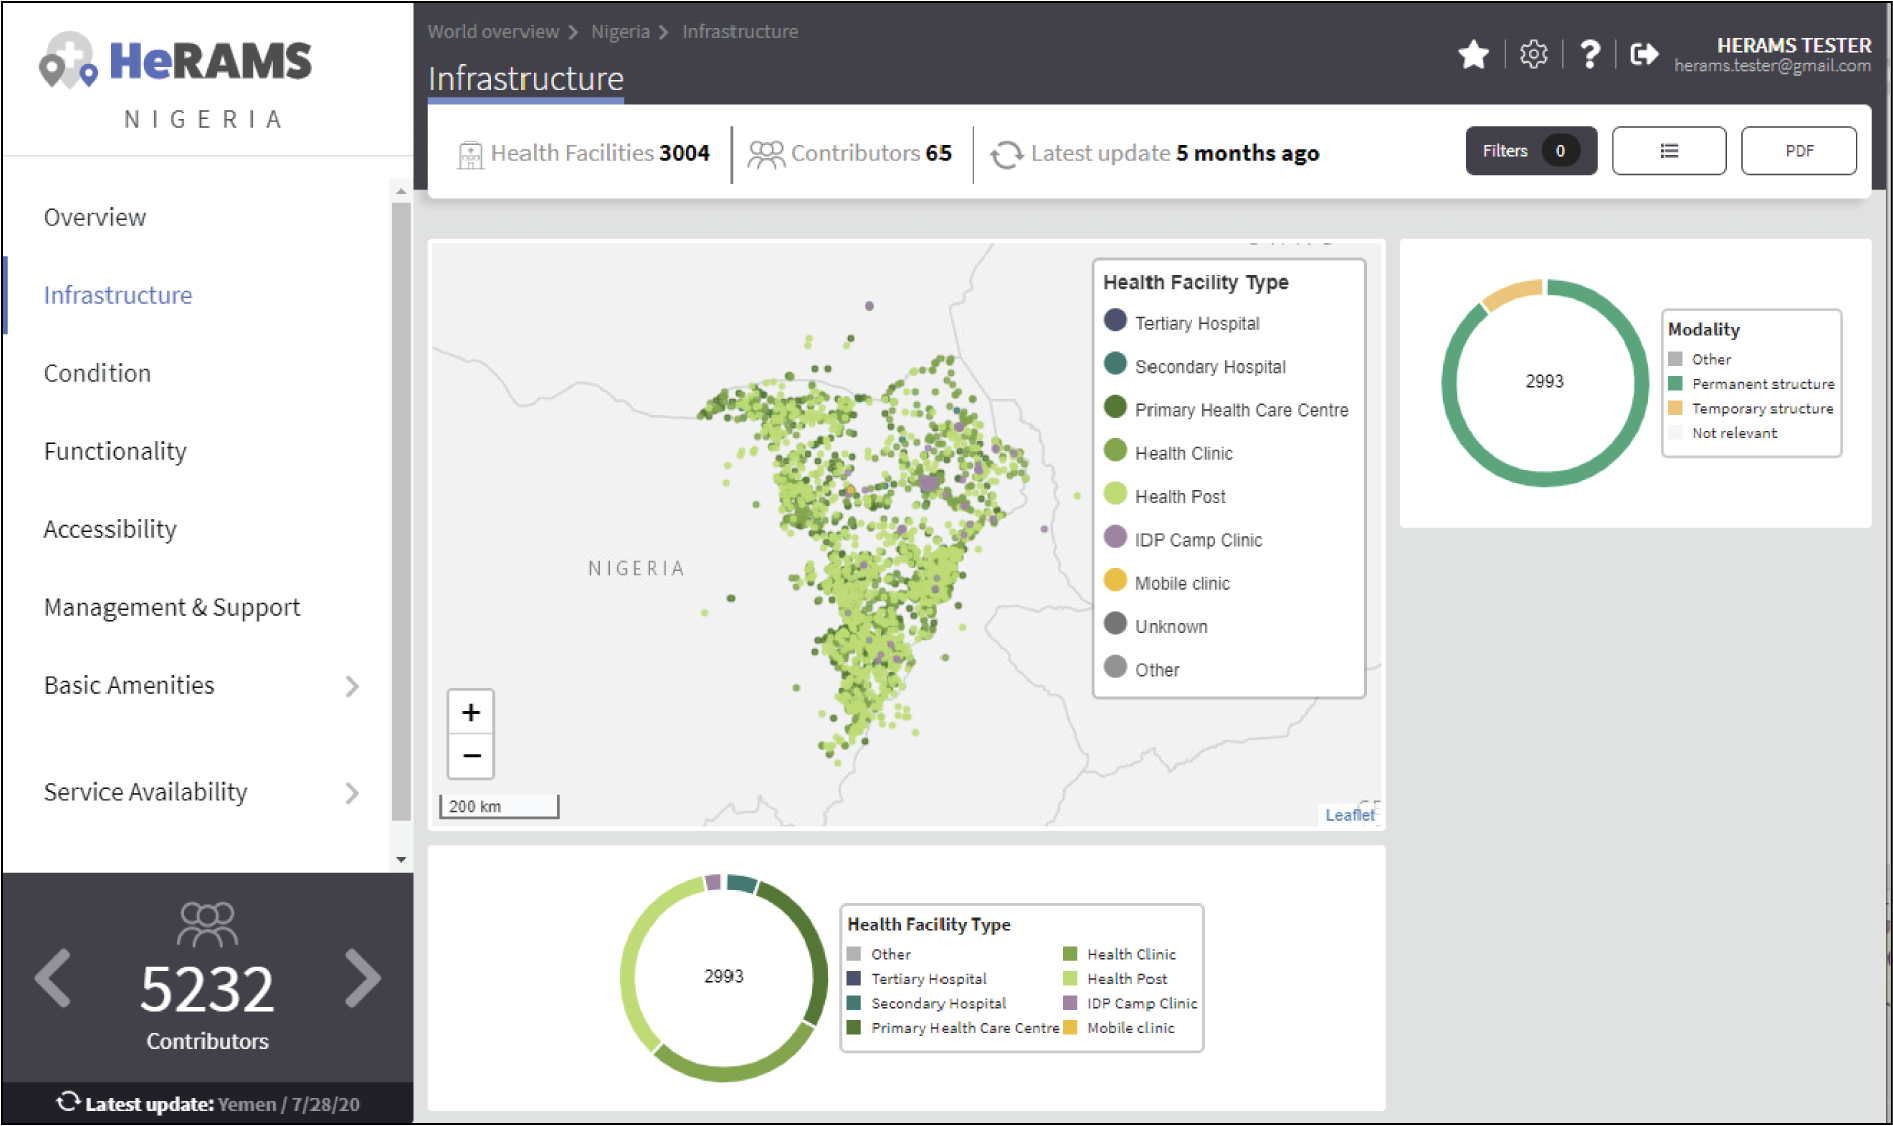
Infrastructure
The Infrastructure page displays a descriptive analysis, including:
- a map to spot the distribution and number of health facilities by type;
- donut charts to illustrate Modes of Service Delivery (MoSDs) by type as well as the modality of the building structure (permanent vs. temporary); and
- a table to illustrate reported accessibility barriers.
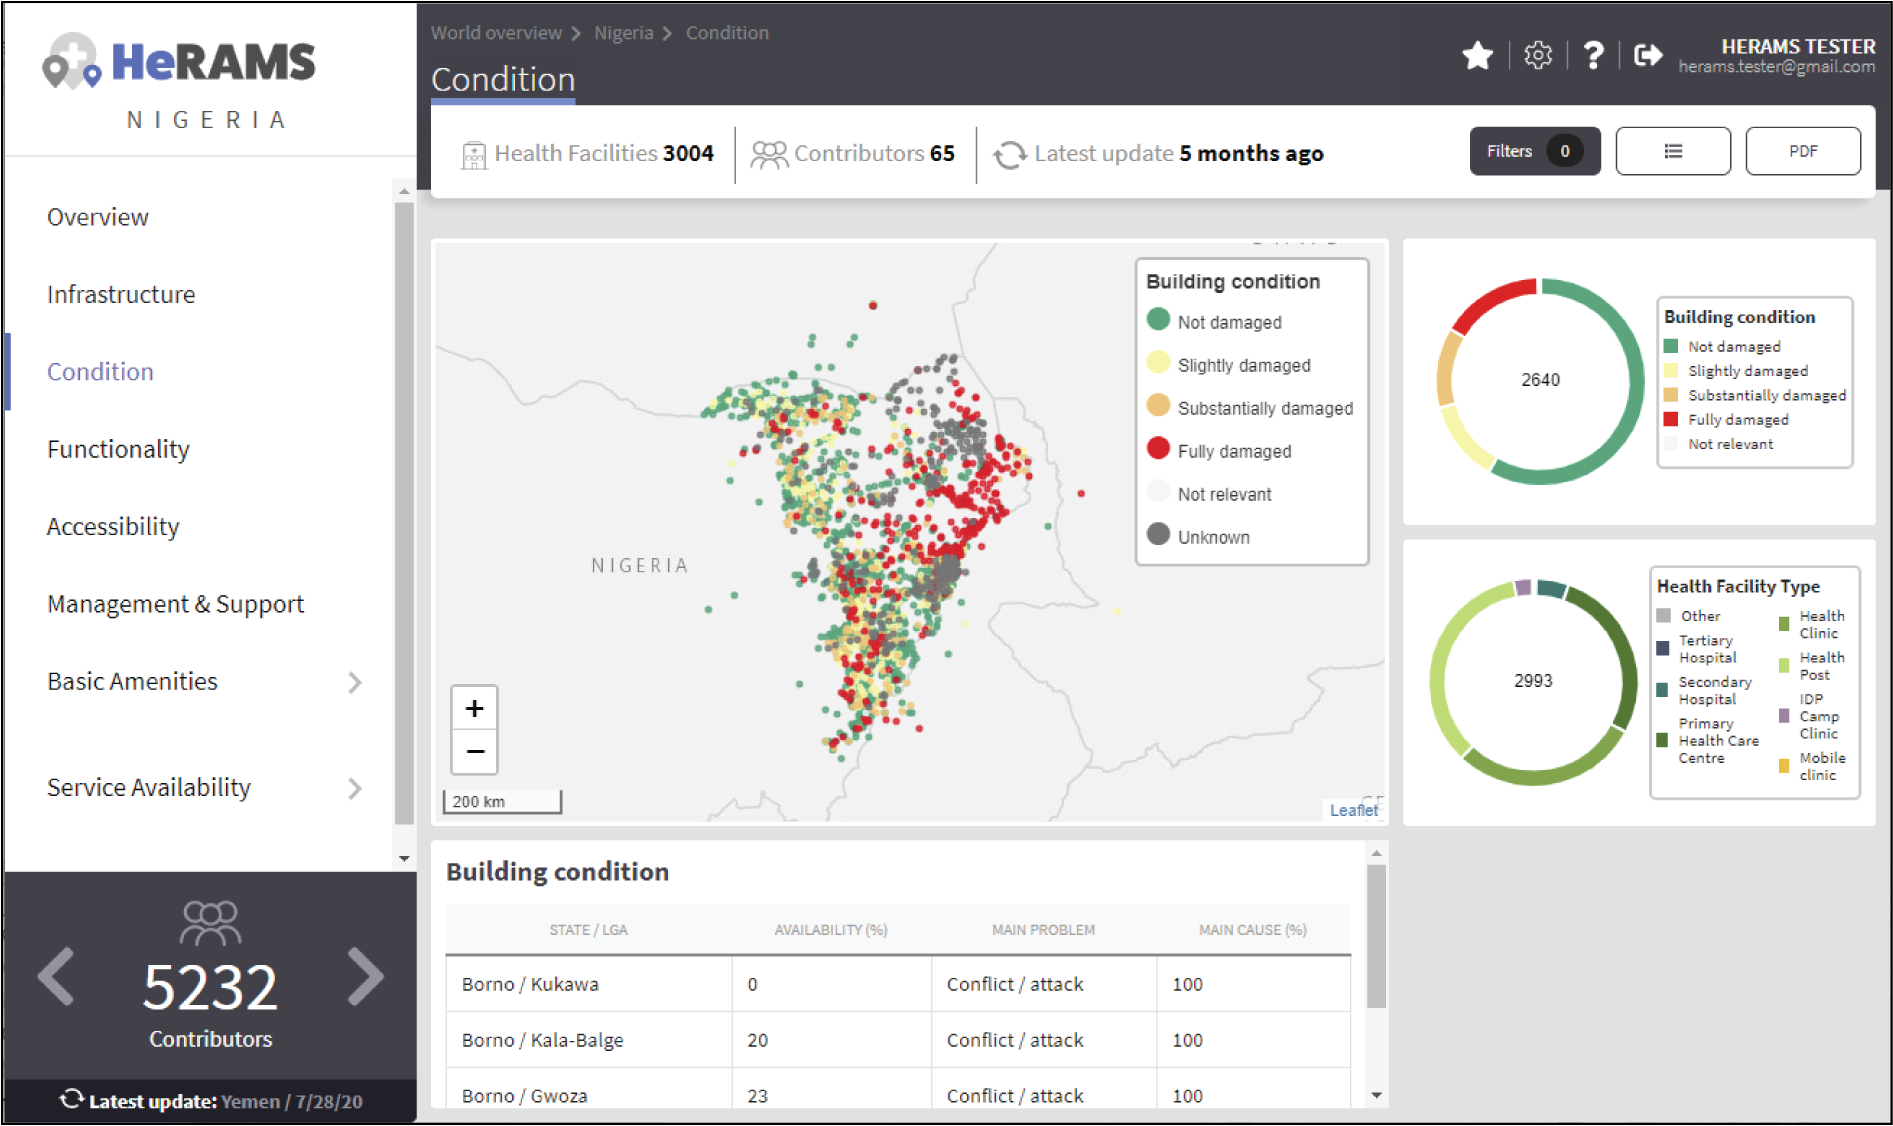
Condition
The Condition page displays the level of reported damage to MoSD buildings following a standard classification and scale (Not Damaged to Fully Damaged). Information is visualized as:
- a map to spot the distribution and number of health facilities according to the level of building damage (i.e. condition);
- donut charts summarizing the reported level of building damage by level of severity as well as the distribution of MoSD by type; and
- a table to provide the name of the prioritized localities in terms of damage and their main causes.
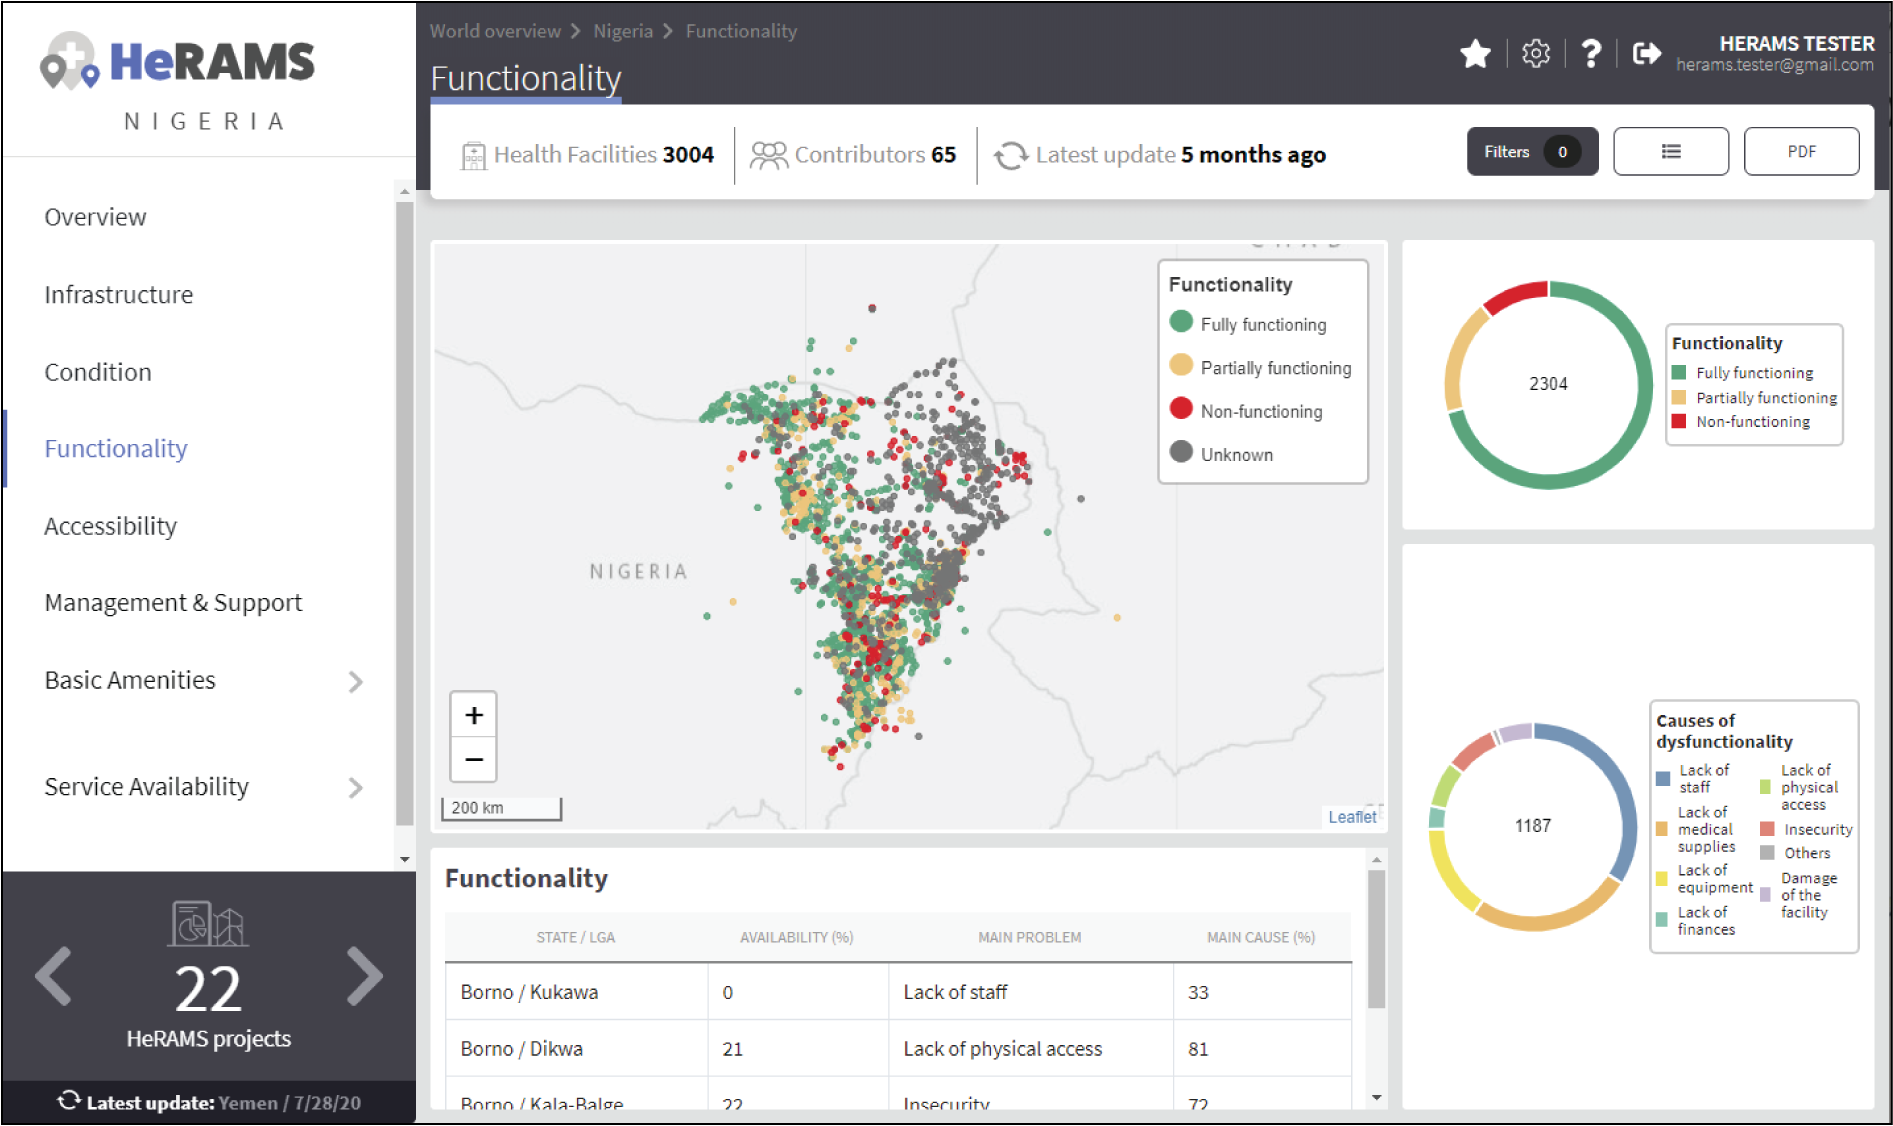
Functionality
The Functionality page displays the level of functionality of the MoSDs following a standard classification and scale (Fully Functioning to Not Functioning) represented as:
- a map to spot the distribution and number of MoSDs according to the functionality status;
- donut charts to summarize the level of functionality as well as main causes of non-functionality; and
- a table displays the list of priority areas in terms of non-functional health facilities and reported causes.
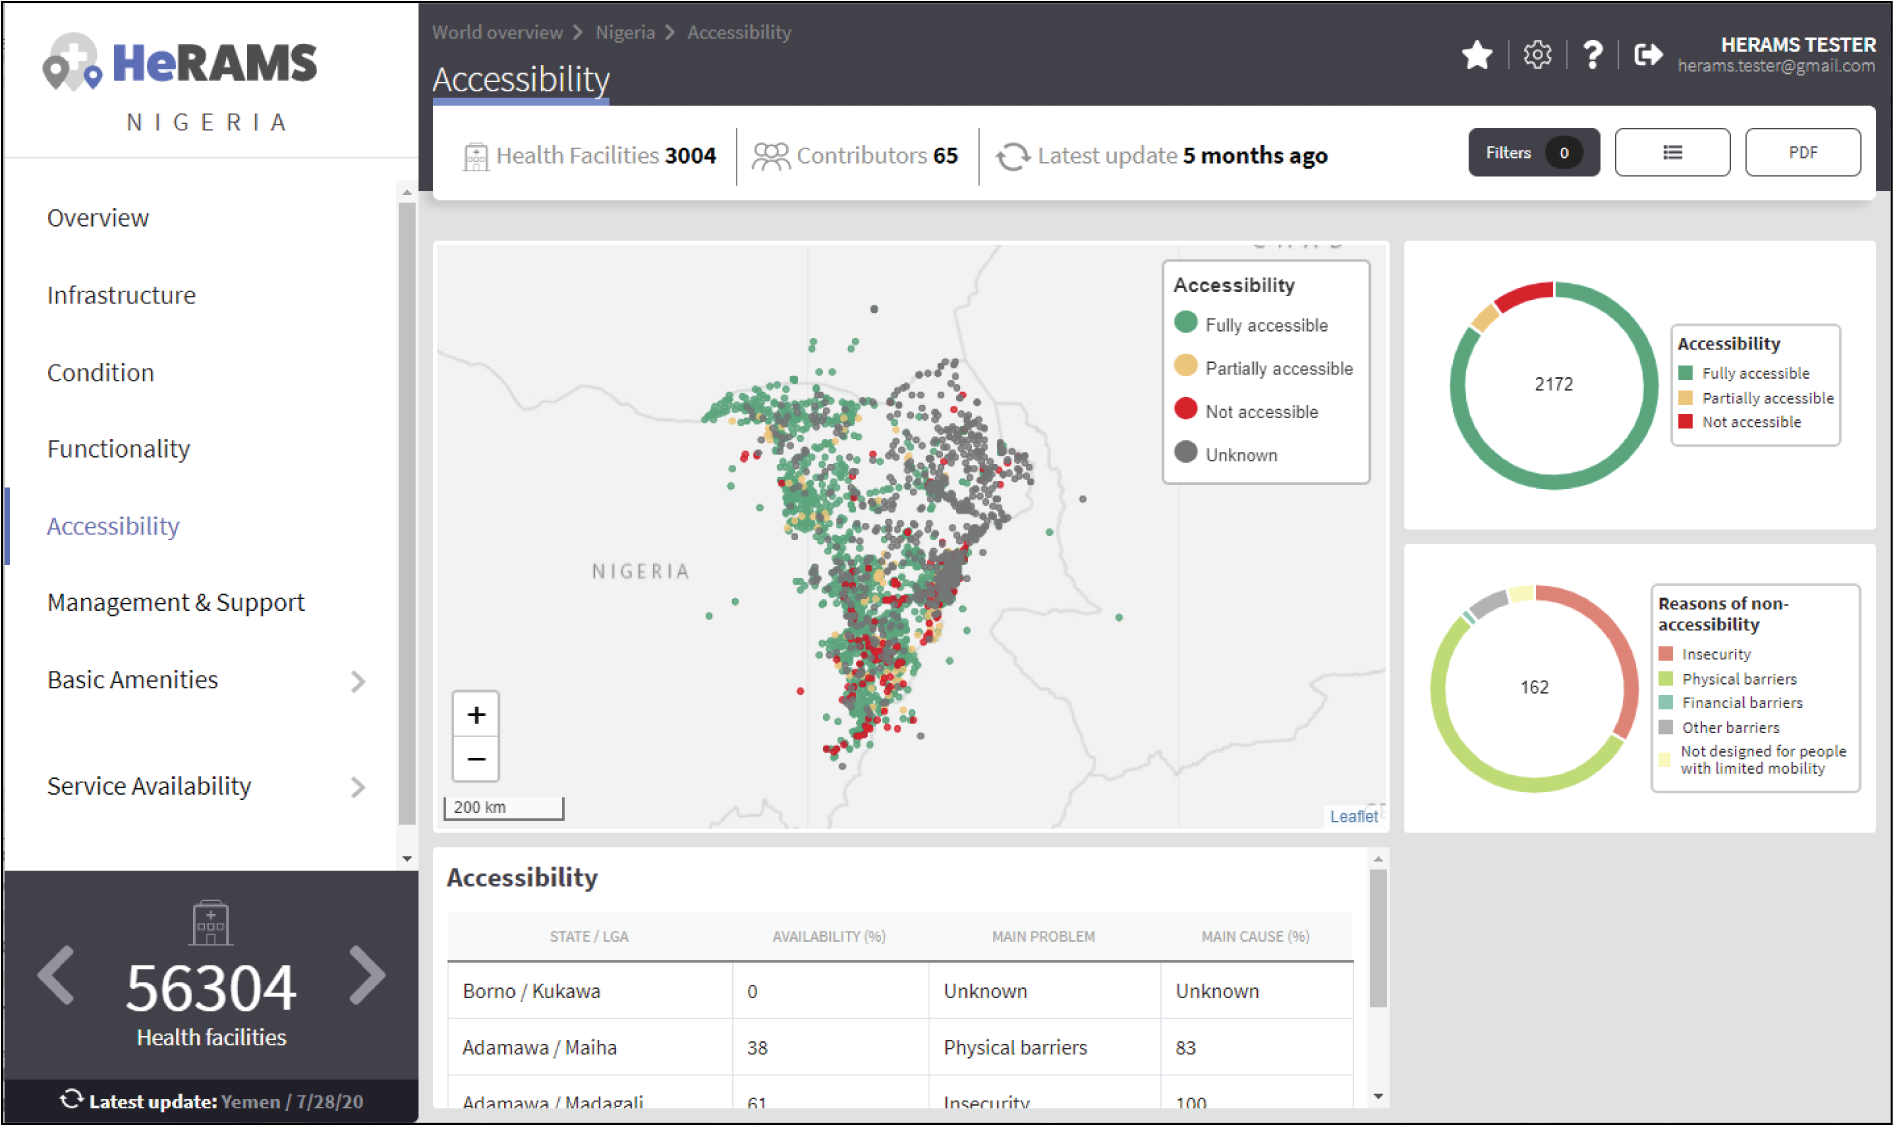
Accessibility
The Accessibility page displays the level of accessibility to MoSDs following a standard classification and scale (Fully Accessible to Not Accessible) in the form of:
- a map to spot the distribution and number of MoSDs according to the accessibility status;
- donut charts to summarize the level of accessibility per number of MoSDs as well as the reported causes of inaccessibility per number of MoSDs; and
- a table displays the list of priority areas with inaccessible MoSDs and the main reported cause of inaccessibility.
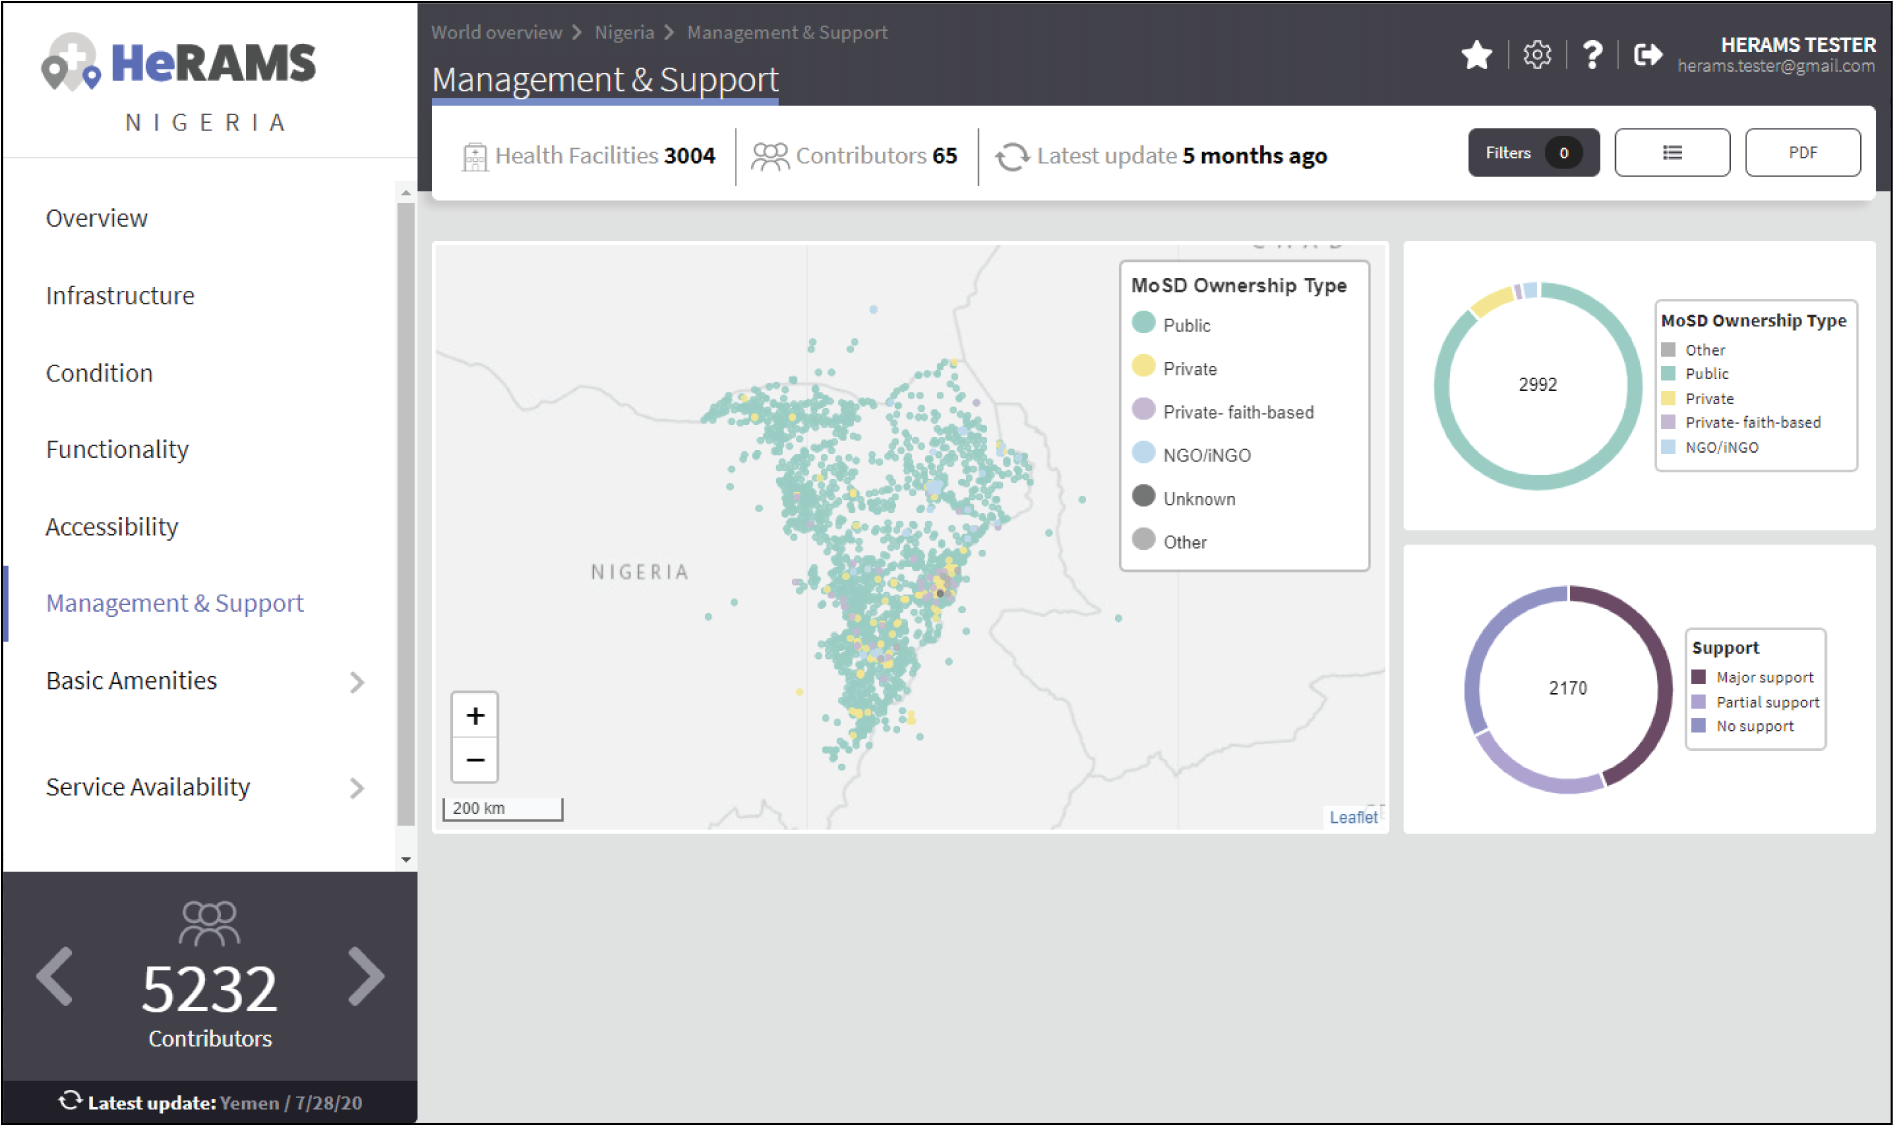
Management & support
The Management & support page displays information on the management of the MoSDs and the level of support provided by partners. The information is illustrated in terms of:
- Ownership:
- A map to spot the distribution of MoSDs according to their ownership (i.e. public, private, faith-based and, NGO/iNGO).
- A donut chart to highlight the categories of ownership as a percentage of the total number of MoSDs.
- External support:
- A donut chart to illustrate the level of support provided by partners.
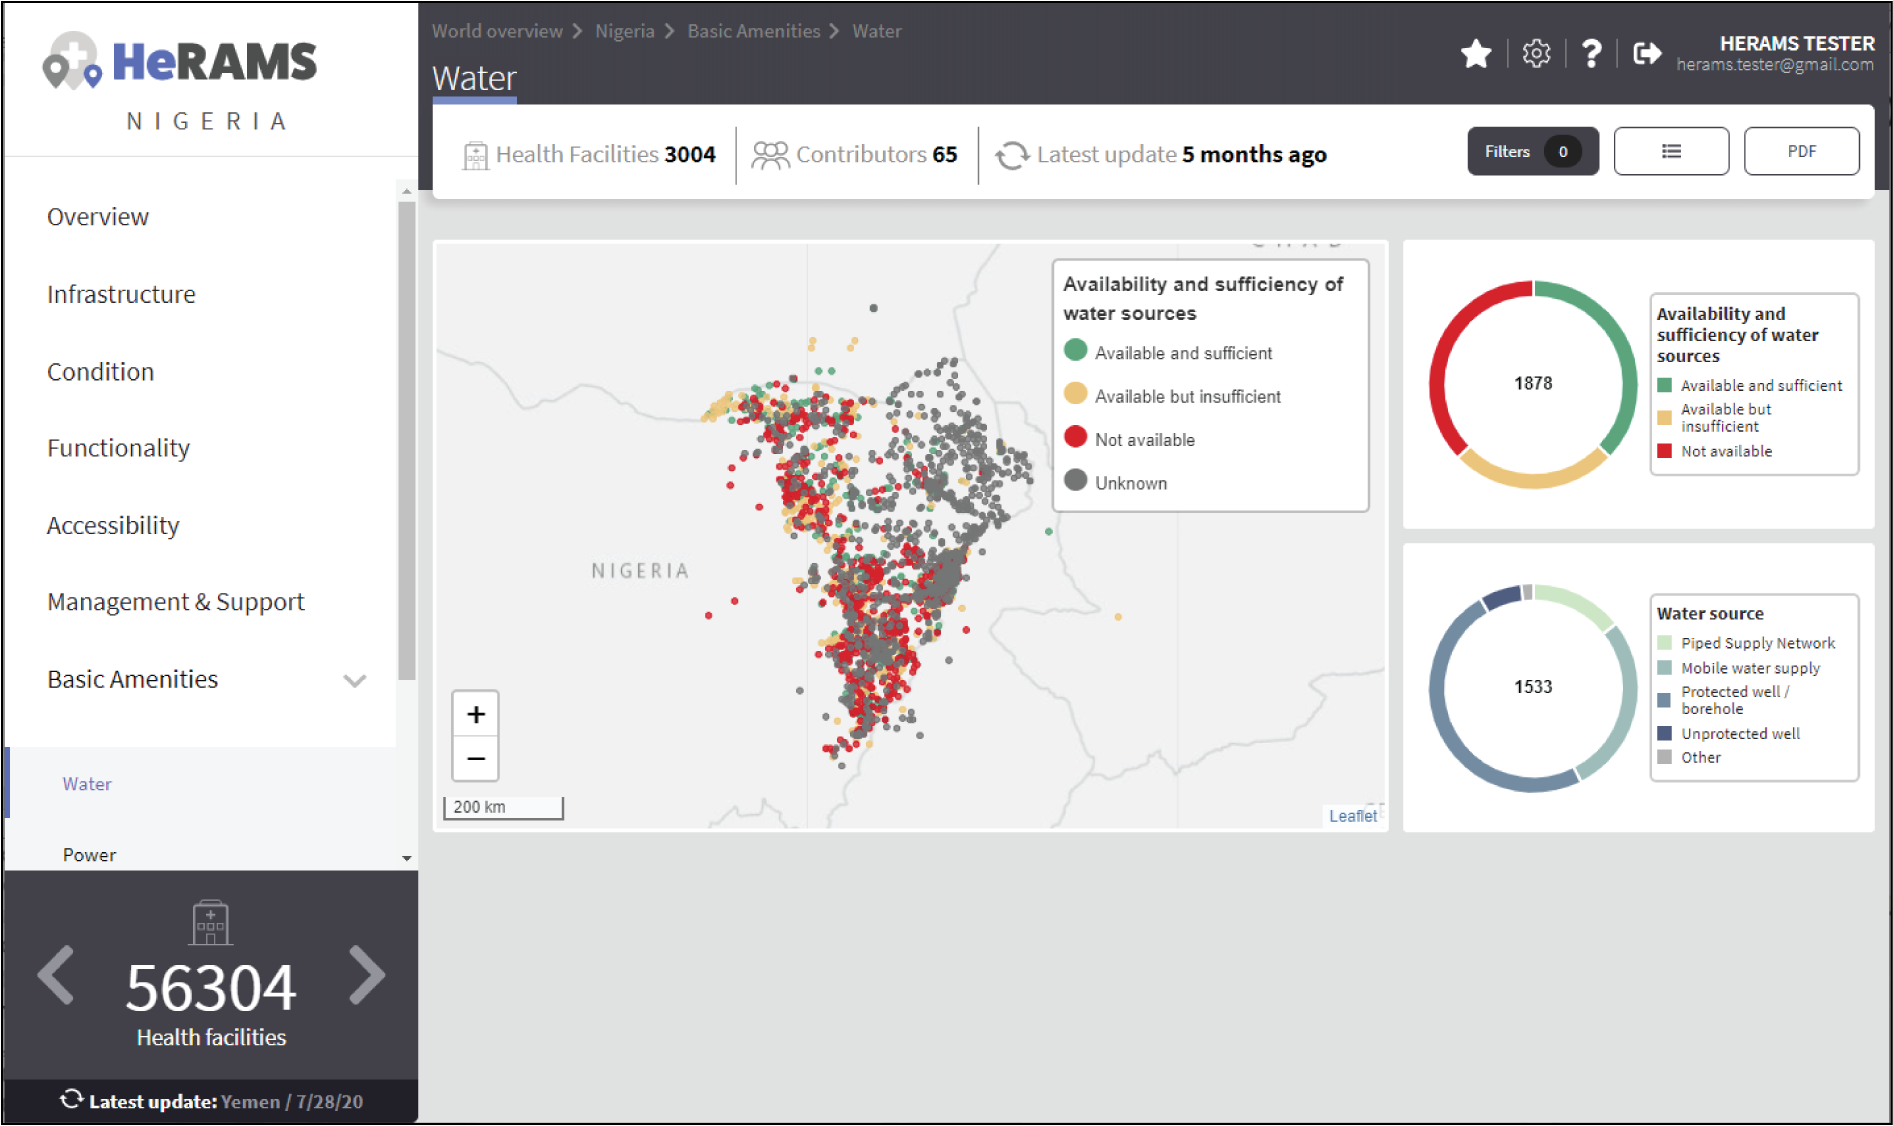
Basic Amenities
Information on Basic Amenities is presented in a series of subpages. Each subpage is dedicated to a particular category and includes:
- a map displaying the availability and sufficiency of the basic amenity; and
- donut charts highlighting the percentage of MoSDs with sufficient availability of the amenity as well as main sources.
Service Availability
The Service Availability page displays multiple pages per type of service. Each page displays:
- a map to spot the distribution of the MoSDs providing the selected health service;
- donut charts to summarize the level of service availability as well as the underlying causes of unavailability of the service; and
- a table displaying the list of priority areas per service unavailability and the main reported underlying causes.
Contribute Data
This chapter is intended for data managers responsible to update HeRAMS data. It covers all aspects related to data editing, including registering new health facilities, updating the status of existing health facilities as well as deleting erroneous records (e.g. duplicates).
Note
Access to the data edit interface is limited to users responsible to update data. If you require your access permissions to be changed, kindly contact the Workspace owner, your Project admin or send an email to herams@who.int specifying your function and role as well as a brief explanation on why you would like your access permissions to be altered.
Access your workspace
HeRAMS uses so-called workspaces to manage access permissions to the underlying data. A workspace may include all health facilities of a geographical region, health facilities managed by a specific partner, or any other logical entity. Each workspace has a dedicated focal point, the Workspace owner, who is responsible for updating the health facilities within their workspace. Workspace owners may invite additional users to contribute to their data. For more information on how to grant users access to a workspace please view the user management section.
- Open the project summary pop-up by selecting your project from the navigation pane on the left. Alternatively, you can open the project summary by clicking the corresponding blue dot on the world map.
- Click the
 button in the bottom right corner of the pop-up.
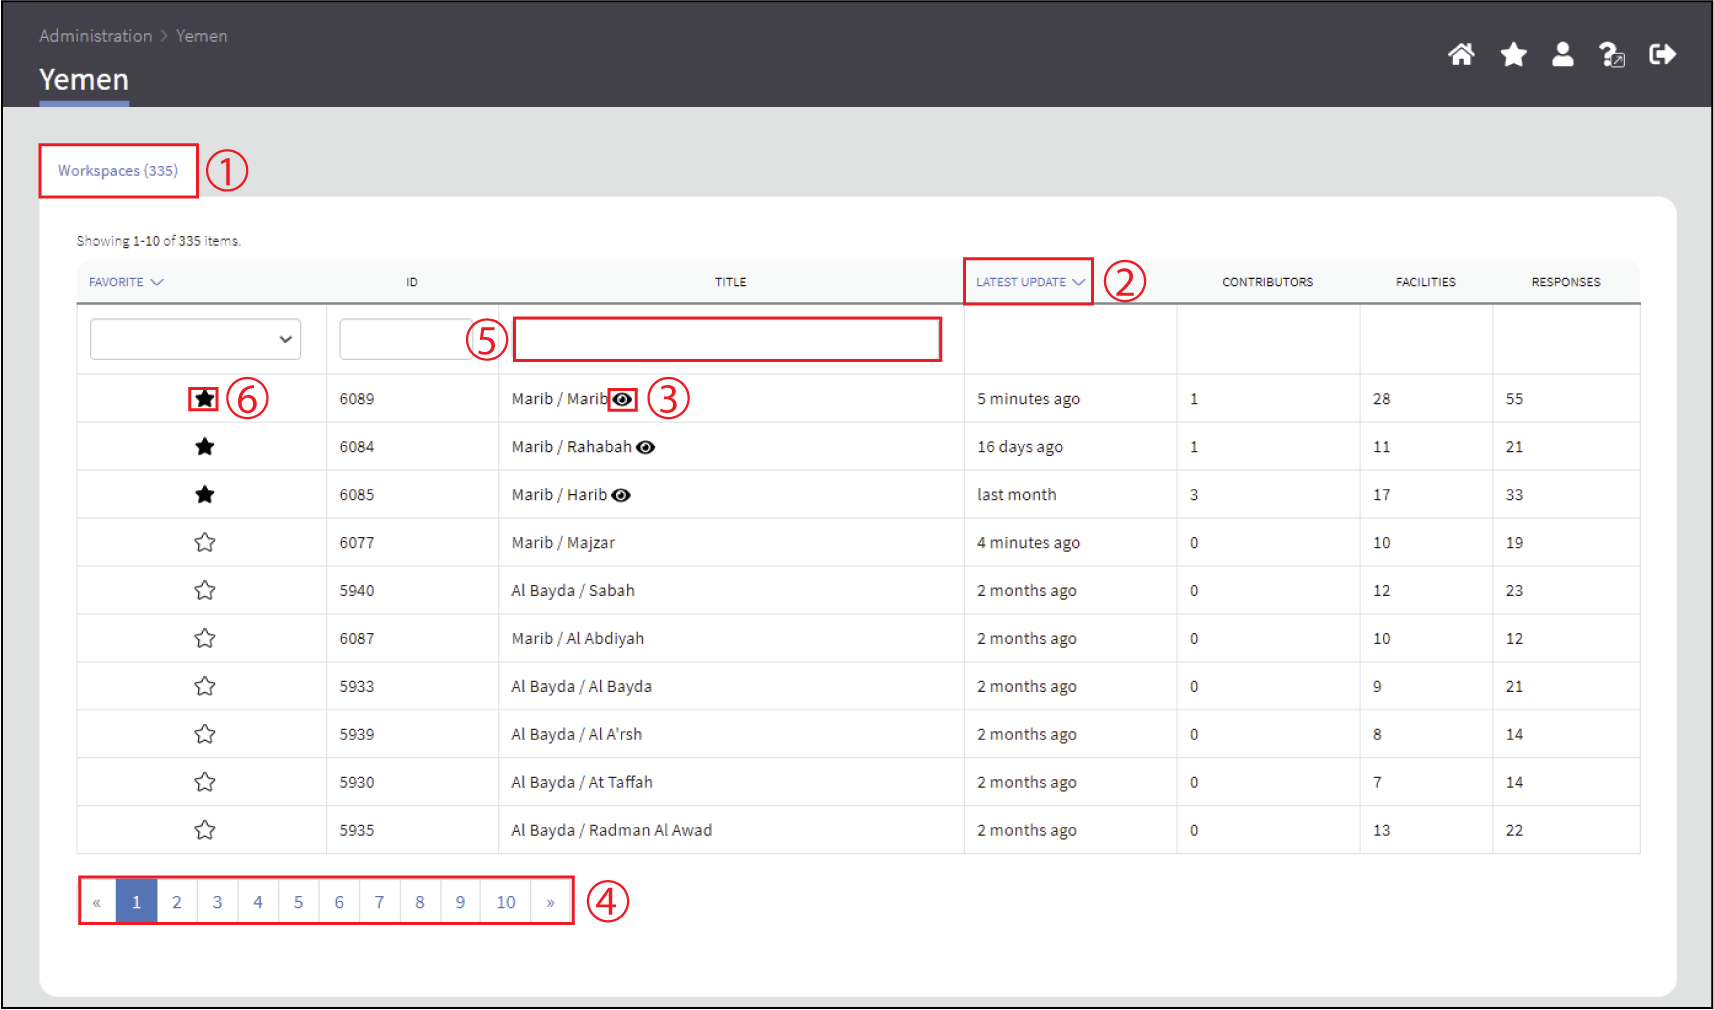
3. This opens a new page displaying a table with the list of workspaces belonging to the selected project. The total number of workspaces available within a project is shown next to the tab title (1). For each workspace, the table displays the date when a workspace was last updated, the number of contributors, health facilities and responses. By default, the list of workspaces is sorted so that the most recently updated workspace appears on top. You can change the order by clicking the header names (2).
Tip
The number of responses can be higher than the total number of health facilities. This indicates that a health facility was assessed multiple times.
- To view the list of health facilities belonging to a specific workspace, click the workspace name.
Note
Access to the list of health facilities requires specific permission. If you don’t see an ![]() icon (3) next to the workspace name you do not have permission to view the list of health facilities. Contact your workspace administrator if you think your permissions need to elevate.
icon (3) next to the workspace name you do not have permission to view the list of health facilities. Contact your workspace administrator if you think your permissions need to elevate.
Tip
The number of responses can be higher than the total number of health facilities. This indicates that a health facility was assessed multiple times.
- If your workspace does not appear, use the page navigation at the bottom (4) or filter the workspaces by typing the workspace name in the field below the header row (5).
- By clicking the
 icon in the first column you can mark a workspace as a favorite. This will make it easier to access your workspace in the future. See below for more information on how to access your favorite workspaces
The video below shows how to access your project, filter workspaces and access your workspace.
Favorites
To simplify navigation, it is recommended that you add frequently accessed workspaces to your list of favorites. Workspaces marked as favorites can be accessed from anywhere in the platform by clicking the ![]() icon in the top right corner of your screen.
icon in the top right corner of your screen.
Note
For users working on multiple projects, please note that it is possible to add workspace from different projects to your list of favorites.
- Navigate to the list of workspaces as outlined above.
- In the first column you should see a icon. To add a workspace to your list of favorites, simply click the icon.
- The icon should have changed to a filled star , indicating that your workspace was successfully added to your list of favorites.
- You can now access the workspace directly from the world map by clicking the icon in the top right corner of your screen.
- To remove a workspace from your list of favorites, clicked the icon again. You should see the icon changing back to an unfilled .
Note
If the workspace does not automatically disappear from your list of favorites, try refreshing the page.
Edit a Response
Caution
Editing a response will overwrite the existing response. If you would like to update the status of a health facility while keeping the history of changes, go to Add a New Response.
- Access your workspace as outlined above.
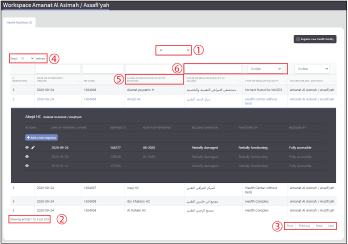
- For multilingual HeRAMS projects, a drop-down list on top of the table permits altering the display language of the table and the questionnaire (1).
Tip
The total number of health facilities within a workspace is shown at the bottom of the page (2). To advance to the next page, use the bottom in the bottom right corner (3). The number of health facilities displayed on a page can be adjusted using the drop-down list in the top right corner (4). Similar to the table of workspaces, clicking the column headers will sort the health facilities accordingly (5). Finally, filters can be applied in the top row above the header to limit the number of health facilities displayed (6).
- For ease of navigation, responses are grouped by health facility. To view individual responses of a health facility, click anywhere in the corresponding row. This will expand the list of existing responses associated with the selected health facility.
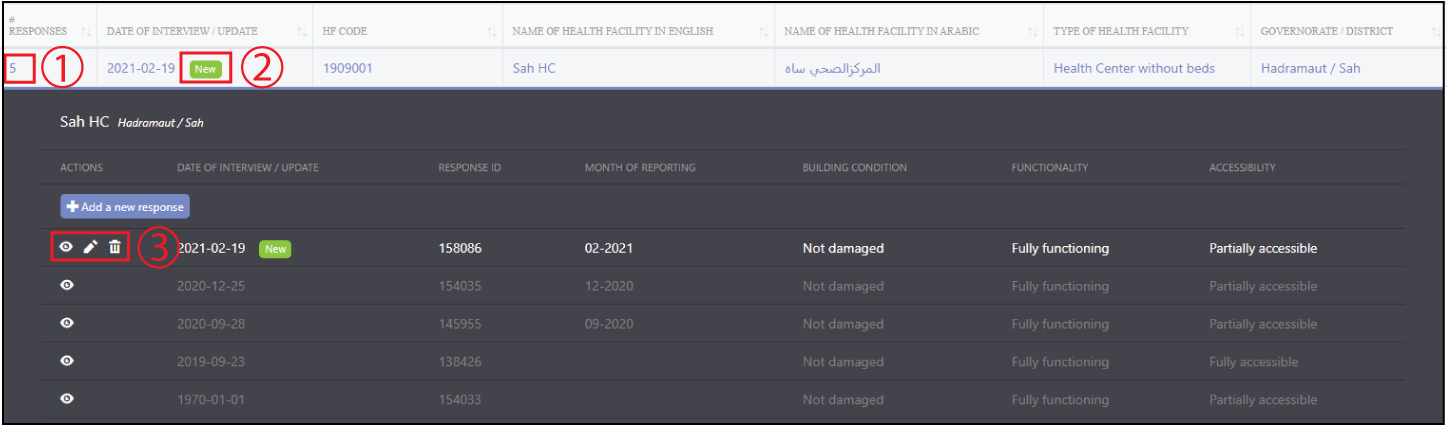
- You should now see a list of all responses belonging to the selected health facility. The total number of responses is indicated in the left-most column (1). The|new| label indicates a newly added response. The label automatically disappears after 48h (2).
- In the left-most column of the list of responses, you should see three buttons allowing you to perform the following actions.
Note
The number of action buttons visible depends on your project’s settings.
- To modify a record click the icon in the Actions columns. You should now be able to edit the selected response. Use the buttons in the lower right corner to move to the
 page of the questionnaire or to return to the
  page. You can also use the navigation pane on the left to access a specific section of the questionnaire.
 - Make sure to validate and save your changes before exiting the record. To save your changes, navigate to the last page, Validate, and click the
 button.
 - If you would like to discard your edits, click the
 button in the lower right corner of the page.
Note
While your project may allow you to save your response and resume later, only records that were submitted will appear on the dashboard and in the export. Thus, once you have completed your edits, make sure to always navigate to the last page (Validate) and click the button.
The video below summarizes the steps to access your workspace and edit a health facility response.
Add a New Response
If HeRAMS is used as a monitoring tool, you can record changes to a health facility by adding a new response. This will add a new response to your health facility while keeping the history of your updates.
Note
This feature is not enabled in all projects. Contact your Project admin or send an email to herams@who.int for further information.
- To add a new response, access your workspace (see Access your workspace for details).
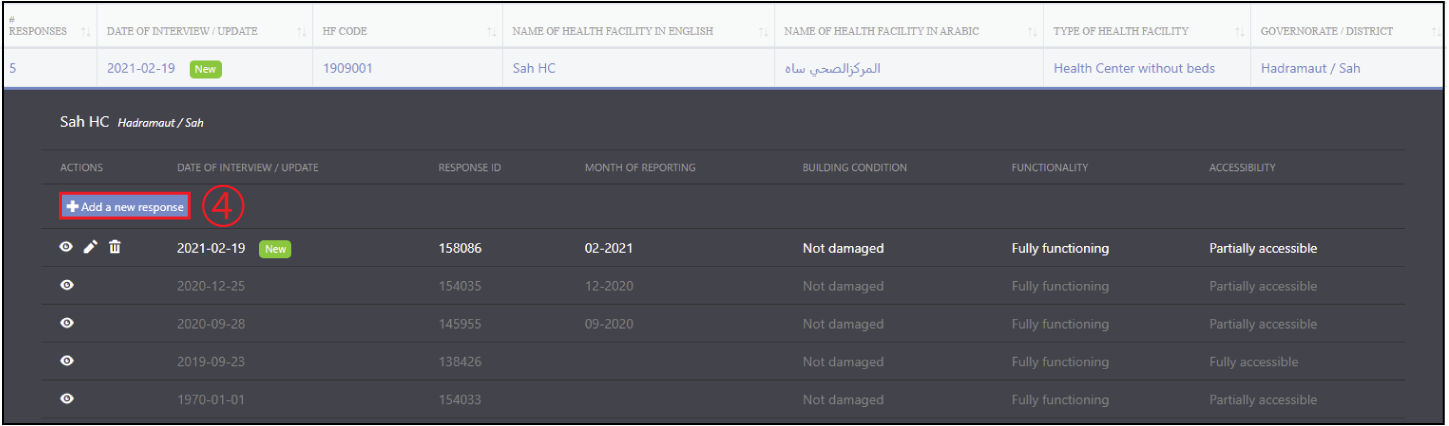
- Expand the list of available responses by clicking anywhere in the corresponding row (see Edit a Response for details).
- To add a new response, click the
 button above the most recent response (see below).
- You should now be able to edit the selected record. Use the buttons in the lower right corner to move to the page of the questionnaire or return to the page. You can also use the navigation pane on the left to access a specific section of the questionnaire.
- Make sure to validate and save your changes before exiting the record. To save your changes, navigate to the last page, Validate, and click the button.
- If you would like to discard your edits, click the button in the lower right corner of the page.
Note
While your project may allow you to save your response and resume later, only records that were submitted will appear on the dashboard and the export. Thus, once you have completed your edits, make sure to always navigate to the last page, (Validate) and click the button.
Note
Upon adding a new response, the previous responses will be locked for editing. This is to prevent users from accidentally overwriting previous responses and thereby losing the history of change.
Register a New Health Facility
- To register a new health facility, access your workspace (see Access your workspace for details).
- Expand the list of available responses by clicking anywhere in the corresponding row (see Edit a Response for details).
- Click the
 button in the top right corner. This will open a blank form, allowing you to register a new health facility.
Note
The ability to add a new health facility may have been restricted by your project admin. If the button is not visible to you, contact your project admin or send an email to herams@who.int specifying your function and role as well as a brief explanation on why you would like your access permissions to be altered.
- Use the buttons in the lower right corner to move to the next page of the questionnaire or return to the previous page. You can also use the navigation pane on the left to access a specific section of the questionnaire.
- Make sure to validate and save your changes before exiting the record. To save your changes, navigate to the last page, Validate, and click the button.
- If you would like to discard your edits, click the button in the lower right corner of the page.
Note
While your project may allow you to save your response and resume later, only records that were submitted will appear on the dashboard and the export. Thus, once you have completed your edits, make sure to always navigate to the last page, Validate, and click the button.
Remove a Response from Health Facility
- To delete a response from a health facility, access your workspace (see Access your workspace for details).
- Expand the list of available responses by clicking anywhere in the corresponding row (see Edit a Response for details).
- You should now see the history of responses to the selected record. To remove a specific response, click the icon in the first column
- If you would like the completely remove a health facility, repeat the above step until all responses have been deleted.
Note
It is only possible to delete the most recent response. Previous responses are locked for editing/deleting to preserve the historical changes.
Note
Only delete all responses to a health facility if you are sure that it was entered by mistake (e.g. duplicated record). For health facilities that are permanently closed, add a new response and change the status to permanently closed.
Warning
Deleting responses cannot be undone. Thus, be careful when deleting responses.
Download Data
Data for individual health facilities can be downloaded as CSV or Excel file.
Note
Whether you have permissions to download data depends on your function and role. If you require your access permissions to be changed, kindly contact your workspace owner, project admin or send an email to herams@who.int specifying your function and role as well as a brief explanation on why you would like your access permissions to be altered.
Download Workspace Data
Follow the instructions below to export data from your workspace. If you require data from multiple workspaces, you can repeat the below steps and merge your data in the analysis tool of choice.
Note
In order to download data, you will require special permissions to the workspace. Contact your system administrator to elevate your access rights if needed.
- To export data, access your workspace as outlined here).
- You should now see a table displaying the list of workspaces available in your project. If you have been granted permission to download data, you should see a second tab labeled “Download” (1). Click the tab name to open the download settings.
- In the download tab you have the option to customize your data export. You can choose between exporting data as text or code as well as the type of header to be included in your export. Use the on/off switches to modify the default options (2).
Note
If you choose to export answers as code, questions with predefined answer options will show coded values instead of the text labels (e.g. A1 instead of “available”).
- If a survey is available in multiple languages, use the drop-down list to specify the export language (3).
- By default, all available responses for a health facility will be exported. For projects with multiple responses per health facility, the report date can be used to limit the number of responses exported. If a report date is defined, only the last record before or equal to the selected date will be exported for each health facility. To get the most recent data, set the report date to today’s date (4).
- Once you have defined the export settings, select between the two export formats (CSV or Excel) by clicking the respective button (5).
Tip
To avoid encoding issues, it is recommended that you download your data as an Excel file if you select a language other than English. For more information on the encoding of CSV files for use in Excel, see Data Encoding in Excel.
Download the Entire Data Set
Project administrators or users with special permissions can export the entire project data from the admin interface.
Note
Access to project level data is limited to selected users only. Contact your country administrator for further information.
- Open your project’s admin pages (see Access your workspace steps 1-2 for details).
- You should now see a table displaying the list of workspaces available in your project. If you have been granted permission to download data, you should see a second tab labeled “Download” (1). Click the tab name to open the download settings.
- In the download tab you have the option to customize your data export. You can choose between exporting data as text or code as well as the type of header to be included in your export. Use the on/off switches to modify the default options (2).
Note
If you choose to export answers as code, questions with predefined answer options will show coded values instead of the text labels (e.g. A1 instead of “available”).
- If a survey is available in multiple languages, use the drop-down list to specify the export language (3).
- By default, all available responses for a health facility will be exported. For projects with multiple responses per health facility, the report date can be used to limit the number of responses exported. If a report date is defined, only the last record before or equal to the selected date will be exported for each health facility. To get the most recent data, set the report date to today’s date (4).
- Once you have defined the export settings, select between the two export formats (CSV or Excel) by clicking the respective button (5).
Note
For large data sets, exporting data in Excel takes substantially longer than exporting as CSV format.
Tip
To avoid encoding issues, it is recommended that you download your data as an Excel file if you select a language other than English. For more information on the encoding of CSV files for use in Excel, see Data Encoding in Excel.
Data Encoding in Excel
If data is downloaded for further analysis in Excel or a statistical software of choice (e.g. R or STATA), data encoding should always be set to UTF-8.
Tip
Encoding issues are particularly prevalent in languages with special character and can result in the data being unreadable. For example, instead of camp de réfugiés you get Camp de réfugiés.
Tip
To avoid encoding issues, it is recommended that you download your data as an Excel file.
The below instructions guide users through the steps to define the data encoding in Excel.
- Open a new Excel file.
- On the Data tab in the Get & Transform Data group, click From Text/CSV.
- In the Import Data dialog box, locate and double-click the text file that you want to import, and click Import.
- In the top left corner of the pop-up window that opens, change the encoding type to UTF-8, and click Import.
HeRAMS Administration
This chapter provides an overview of the admin pages in HeRAMS and offers step-by-step instructions for common tasks performed by advanced users (e.g. Workspace owners and Project admins). The first part of the chapter focuses on user management. It provides an overview of the default User roles used throughout the platform followed by a detailed description of how to add users to workspaces and projects. The remaining parts of this chapter focus on more advanced topics and are intended to guide Project admins on how to administer a project locally.
Note
Access to different parts of the admin interface depends on your function and role. If you require your permissions to be changed, kindly contact your Project admin or send an email to HeRAMS Support Team specifying your function and role as well as a brief explanation of why you would like your access permissions to be altered.
User Management
Workspace Permissions
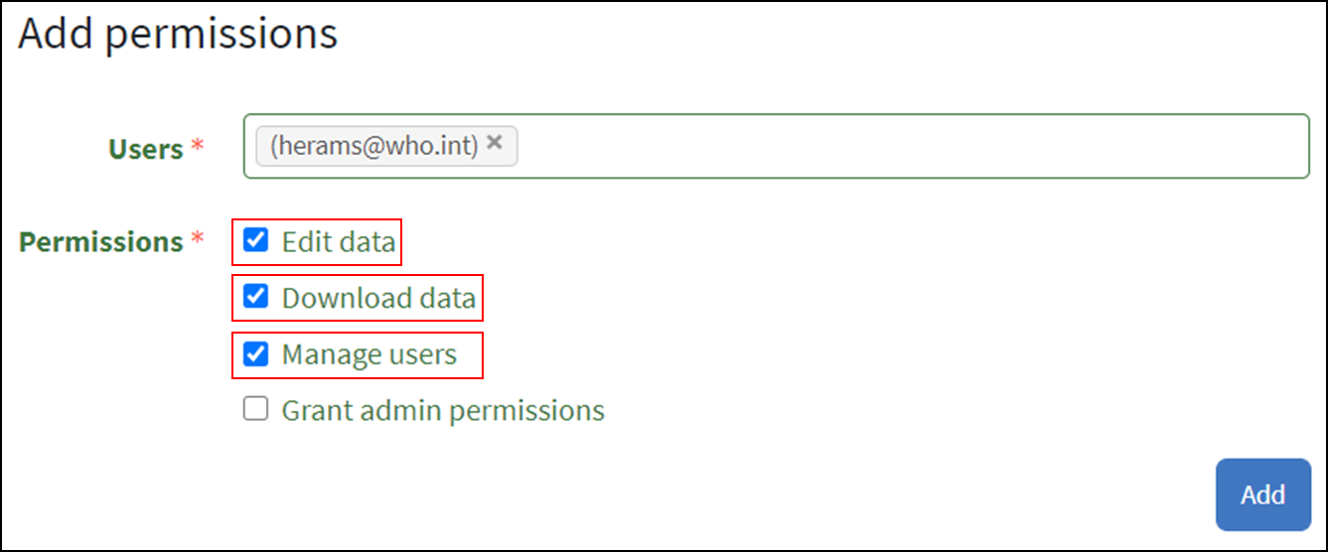
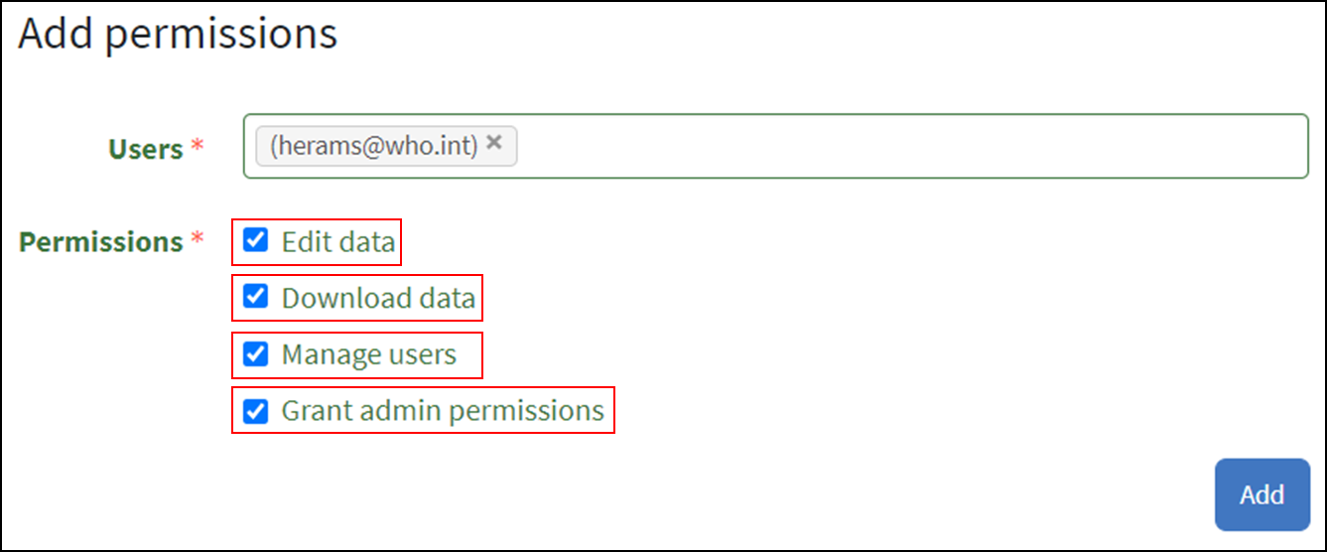
The use of workspaces permits users to manage a set of health facilities (e.g. all health facilities within a district) autonomously. Workspace owners have full control over their workspace and can decide to invite other users to contribute or access their data. There are four permissions at the workspace level:
Edit data: Allows users to create, edit and delete records.
Download data Enables users to download all records from a workspace for further analysis in external applications.
Manage users: Permits users to share access to a workspace with other users.
Grant admin permissions: This permission is only available to Project administrators and should only be granted to workspace owners. It provides a user with full admin privileges to a workspace, including the ability to grant another user the permission to invite new users.
Note
The ability to invite new users to contribute or manage a workspace depends on the permission of the user granting access. A user with permission to invite other users can only grant permissions they themselves have. Hence, it is possible that a user with the permission to ** manage users** is not able to grant access to edit or download data to other users.
Access to workspaces and projects should always be granted with regards to the users’ roles and responsibilities. For more information on user roles and the recommended permissions for each role consult the sections user roles and mapping user roles to permissions.
Project Permissions
Similar to workspace permissions, permissions can also be granted at the project level. It is important to note that if permissions are granted at the project level, users are being granted access to all workspaces. For example, if a user is granted edit permission at the project level, they can edit data in all workspaces. In contrast, if a user is granted access at the workspace level, they are only able to contribute data to that specific workspace.
There are six permissions that can be granted at the project level:
View dashboard: Grants access exclusively to the project dashboard. Granting users explicit access to the project dashboard is only required for closed or private projects. For all other projects, any user subscribed to the platform will be able to view the project dashboard.
Edit data: Allows users to create, edit and delete records in any workspace of the project.
Download data: Enables users to download the entire dataset, including records from all workspaces for further analysis in external applications.
Manage workspaces: Grants a user access to create, modify and delete workspaces as well as the ability to invite users to contribute to an individual workspace.
Warning
Workspace owners must be granted permission at the workspace level. If a user is granted permissions to Manage workspaces they will have access to all workspaces.
Configure dashboard: Grants users the ability to configure their project dashboard.
Manage survey Grants permission to access the survey configurations. This permission can only be granted by a global administrator.
User Roles
There are six standard user roles used accross projects.
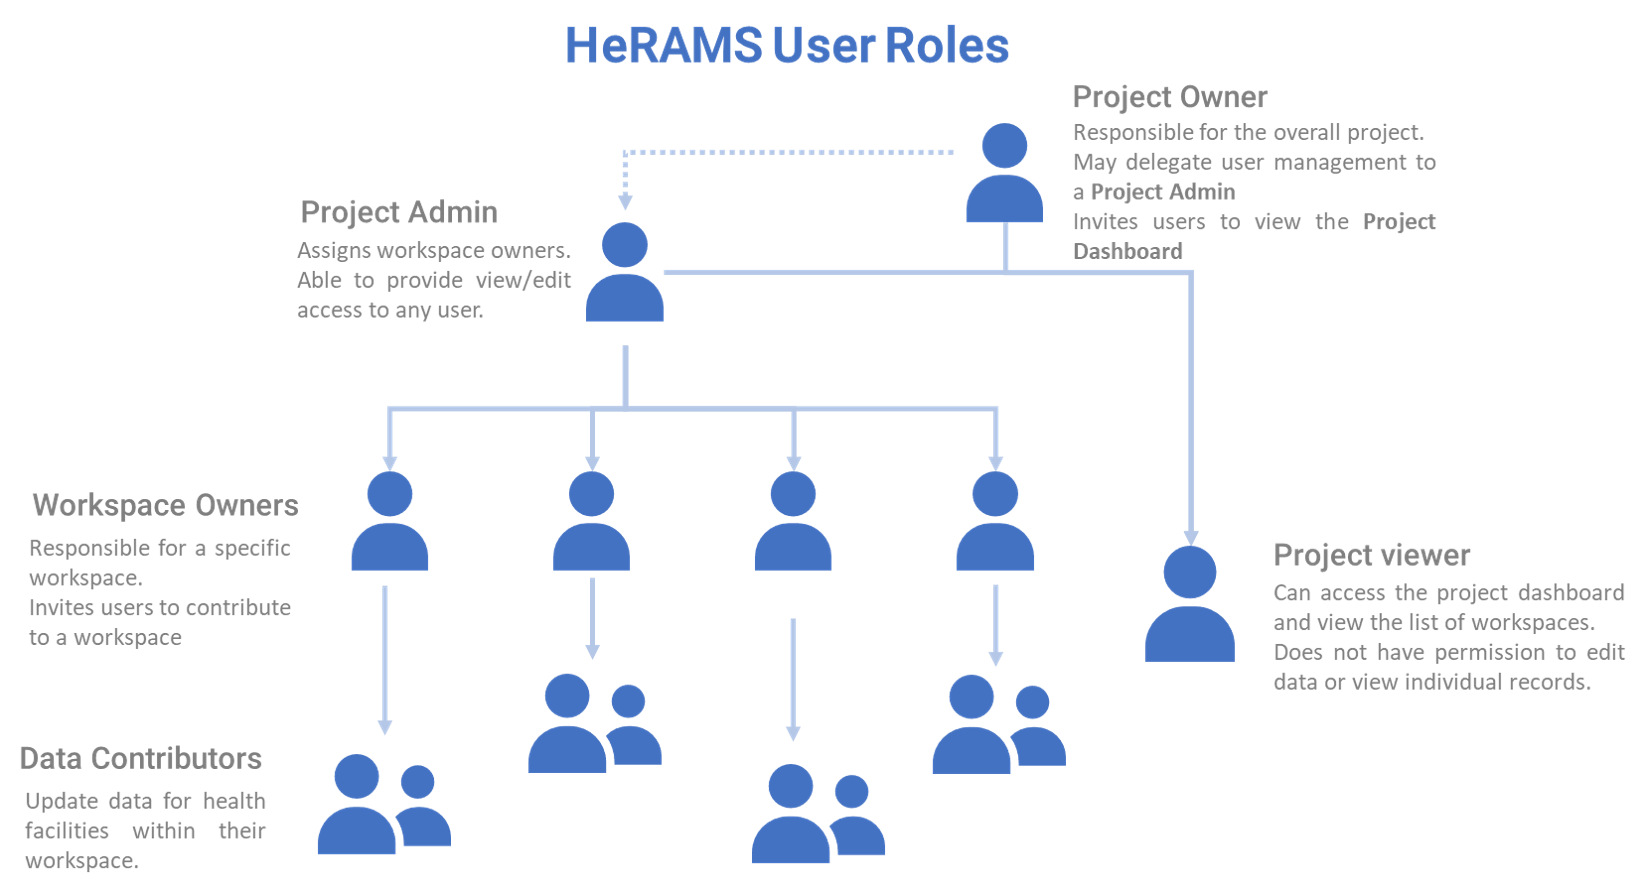
Project owner: The designated person who is responsible for the HeRAMS project. They can invite users to view the project dashboard or the list of available workspaces but are not expected to conduct the daily activities of managing users and assuring data quality.
Project admin: The project owner typically relies on an Information Management Officer to manage the daily activities of the HeRAMS project and assigns them the role of project admin. The project admin has access to all workspaces. Depending on the project setup, they might also be assigned to configure the project dashboard. While project admins are responsible for the overall training and management of users, they can assign Workspace owners to manage individual workspaces.
Workspace owner: Are commonly at the sub-national level, overseeing data collection for a specific area (e.g. a district). They have full control over their workspace and can invite other users to contribute to their workspace. It is important to note that workspace owners can only edit or share access to the workspaces they own. However, like any user having been granted access to a project, they can explore data from other workspaces using the project dashboard.
Data contributor: Support the workspace owner in collecting and managing information on individual health facilities. Like workspace owners they can only edit data within their workspace but are able to view the overall project by accessing the project dashboard.
Data viewers: Under exceptional situations, a user might be granted the role of data viewer. This means they are granted access to download the workspace data but are unable to edit data. Like all users having been granted access to a project, they are also able to access the project dashboard.
Project viewer: The role of project viewer is intended for users at any level who rely on HeRAMS data for their own work. Their access is limited to the project dashboard and the list of available workspaces.
Note
If a project is set to private or closed access to the project dashboard can be further restricted. Please consult Project Settings for further information on project statuses.
Mapping User Roles to Permissions
Data contributors: data contributors are granted access to edit data for individual workspaces.
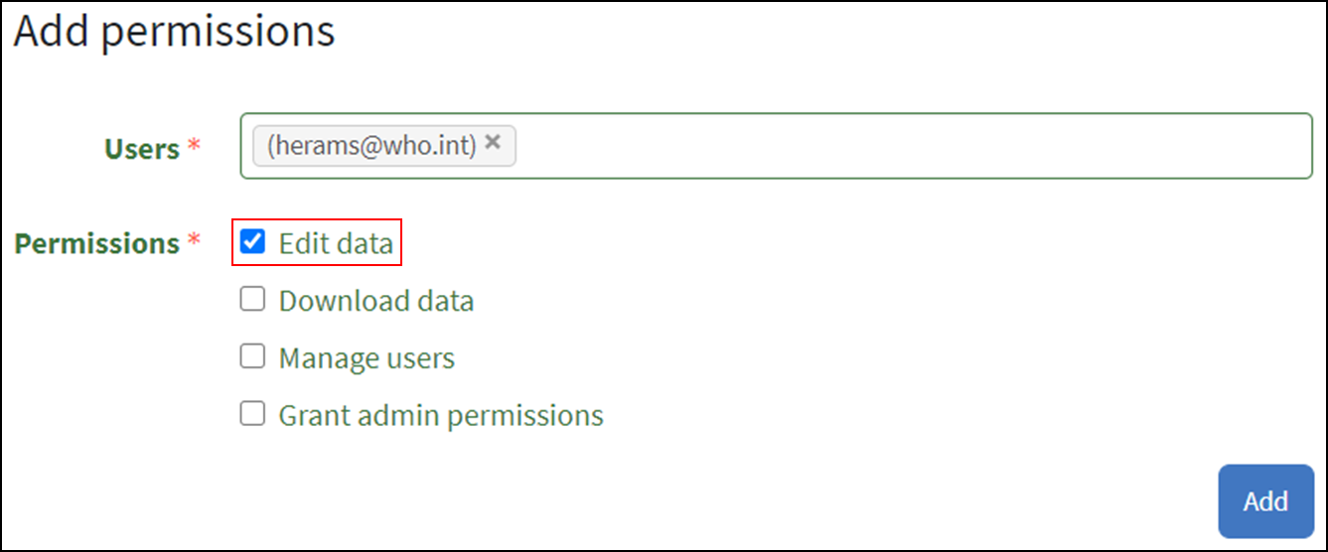
Optionally, data contributors can also be granted permissions to download data.
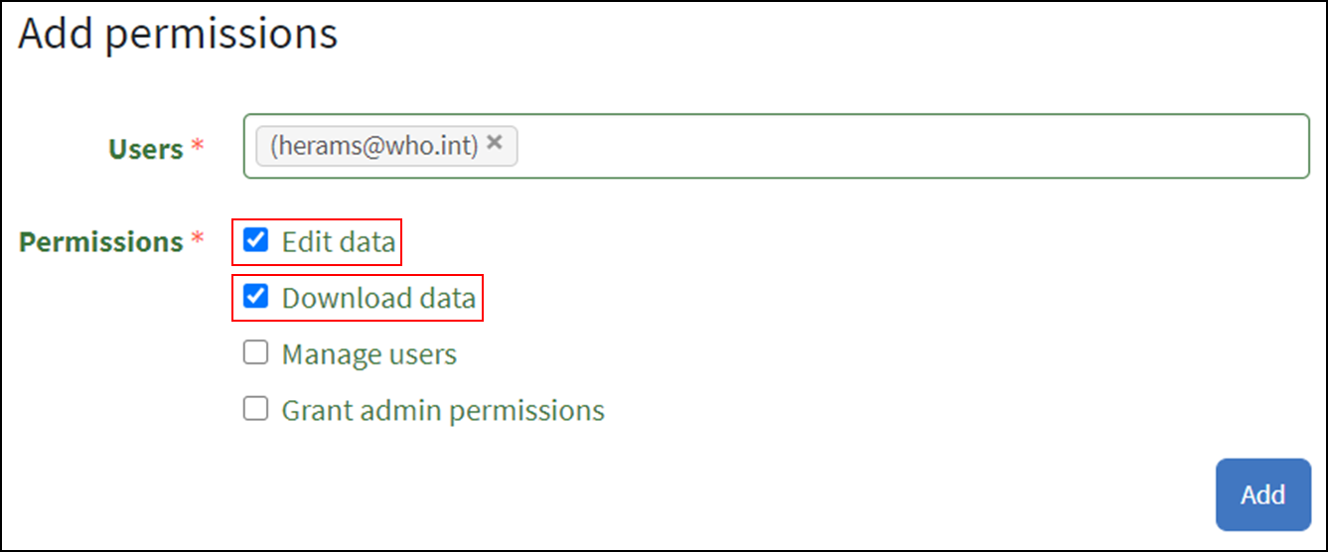
Data viewers: It is possible to grant users access to download data without providing them with edit rights. While this permission is commonly combined with the permission to Edit Data, under special circumstances, permission might only be granted to download data.
Workspace owners: In addition to editing and downloading data, workspace owners are granted permission to manage users. This grants them the ability to invite other users to contribute to their workspace.
Under special circumstances a project admin might grant a workspace owner admin permission to a workspace, allowing the workspace owner to delegate managing user access for their workspace. This permission should be used carefully and only granted if absolutely necessary.
Warning
While workspace owners may delegate granting access permissions to another user, they remain responsible for their workspace and users having access to it.
Add a User
- To grant a user access to your project, navigate to the list of workspaces of your project. If you would like to grant access to a specific workspace only, open the workspace by clicking the desired workspace’s name. See Access your workspace for details.
- Click the Users tab to open the user management section.
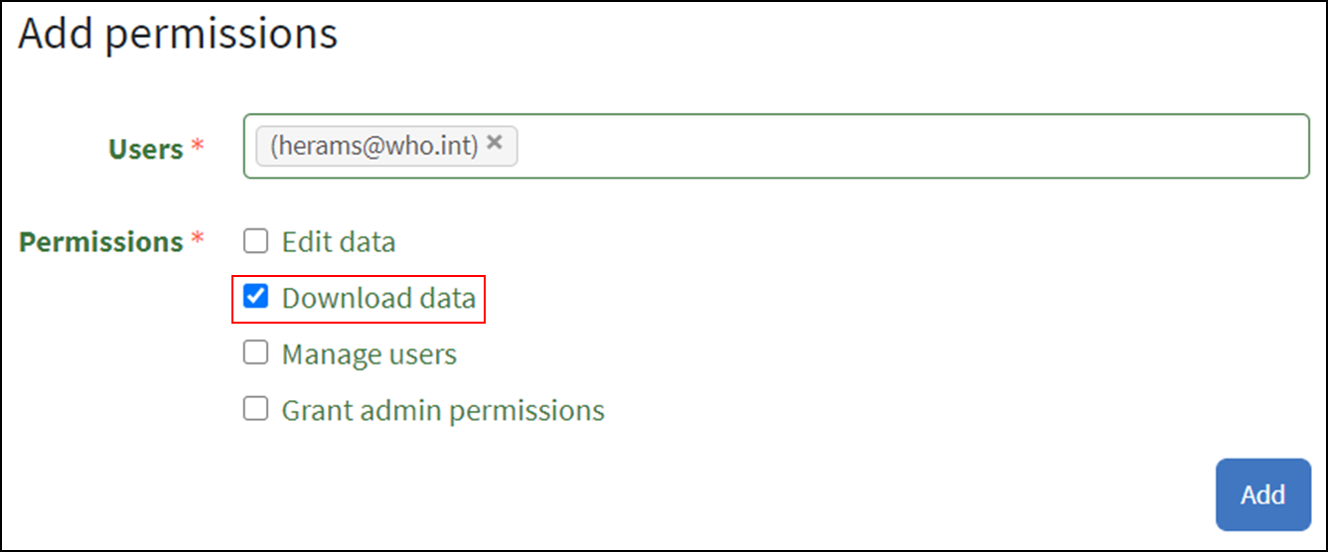
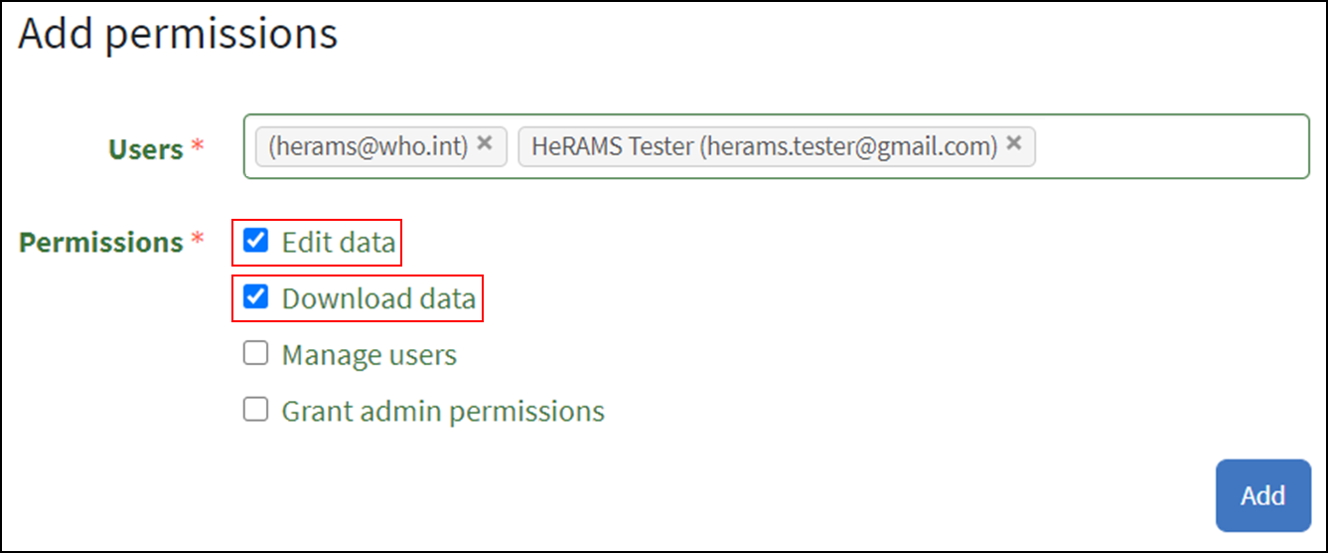
- You should now see a page similar to the image below. On the bottom half of the page, you can see a list of all users currently having access to the workspace including their permissions. In the top half of the page, you have the option to add a new user. Start typing the user’s name in the top field. You will notice that the list of available users dynamically filters as you are typing. Select the user you would like to add.
Tip
You can add multiple users add once as shown in the image above.
- Use the checkboxes to select the appropriate permission level. See Workspace Permissions or Project Permissions for further details on workspace permissions.
- Click the
 button to grant users the desired permissions.
Change a User’s Permission
- Follow the instructions outlined above to open the user management interface of your workspace or project.
- On the second half of the page you will see a list of all users having access to the workspace or project, including their permissions.
- You can change a user’s permission by flipping the corresponding switch button to Allowed or Denied.
Remove a User
- Open the user management interface of your Workspace or Project. See here for more details on how to access the user management interface.
- On the second half of the page you will see a list of all users having access to the workspace or project, including their permissions.
- To remove a user change all permissions to Not allowed. Upon reloading the page, you will see that the user has disappeared from the list (see video above).
Note
Removing a user from a Workspace will not revoke their Project level permissions and vice versa.
Manage Workspaces
Managing the list of available workspaces is a key component of the Project admin’s role. In addition to being able to create, edit or delete workspaces, managing workspaces also includes assigning Workspace owners and granting them appropriate permissions.
Create a Workspace
- To create a new workspace, navigate to the list of workspaces of your project. See Access your workspace steps (1-2) for details.
- In the upper right corner, you will see a button labeled
 .
. - You will be directed to a page where you will be able to create a new workspace.
- Enter the workspace’s name into the title field.
- Use the dropdown list to select the corresponding Token or create a new token by selecting Create new token.
Note
Tokens are unique identifiers that link health facilities to workspaces. To add a health facility to a workspace the token of the record in question has to be manually changed. Contact your system administrator for guidance on how to change a record’s token.


Configure the Project dashboard
For each HeRAMS Project, an interactive dashboard can be configured providing summarizing key indicators and findings of a project. This section provides project administrators with a detailed description on how to edit these dashboards. An overview of the standard dashboard pages is available here.
Create a Dashboard Page
- To add a new page to a dashboard, open your project’s admin page.
- Open the Dashboard settings tab. You should now see a table with the list of existing dashboard pages.
- To add a new page to the dashboard, click the
 button in the top right corner.
Note
To create the standard HeRAMS dashboard, export an existing dashboard from another project using the Export all button. This will export a JSON file. Return to your project and import the JSON file using the Import dashboard button. Once imported, you can adjust individual pages and elements according to your needs.
- Enter the page name in the top field. It is recommended to select an item from the drop-down list. This will assure the page title is automatically translated into other languages.
- If you are adding a sub-page to an existing page, select the parent page from the Parent Id drop-down list. For all other pages select No parent.
- Define the page order by entering a Sort index. Increment the index by 1 for each new page, starting with 0 for the first page.
- Click the
 button to add the page to the dashboard.
 - To return to the list of available dashboard pages click the
 button.
Note
You only created an empty page. To add elements to your page, see section Create a Dashboard Element.
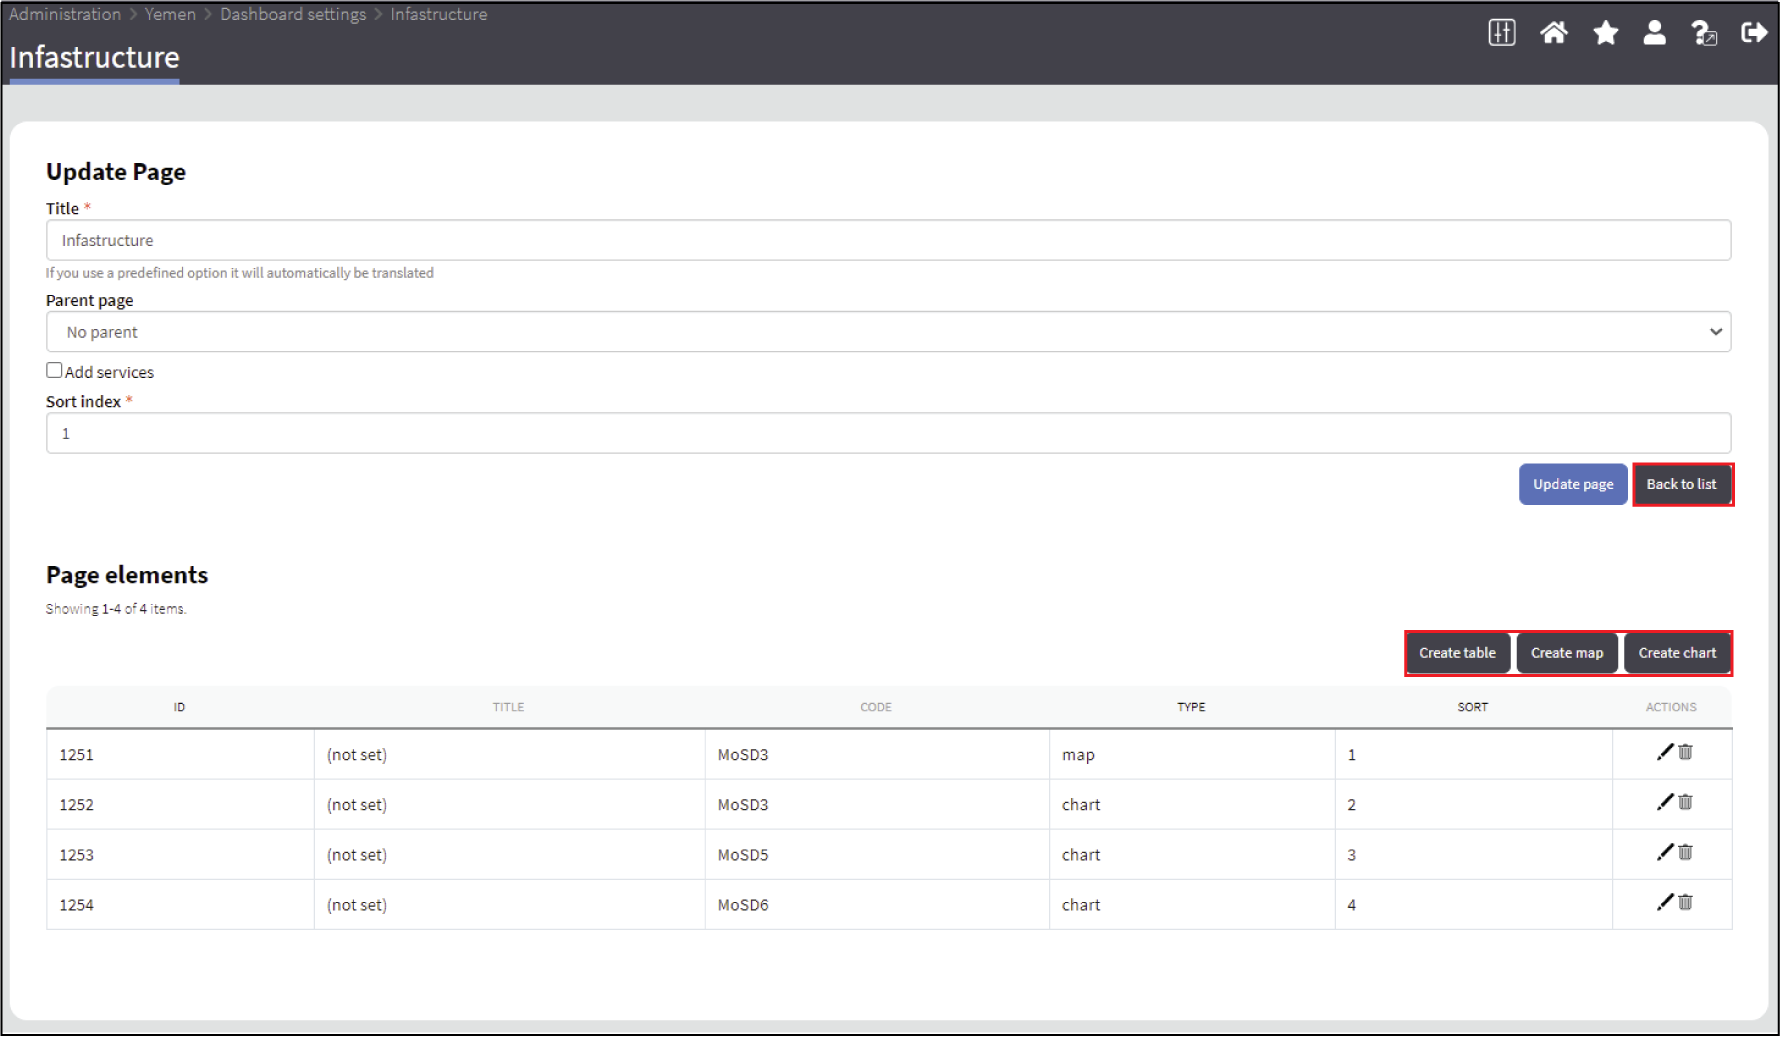
Modify a Dashboard Page
- To modify an existing page, access the list of existing pages as detailed above.
- Click the
 icon next to the page’s name. This will open the page’s settings. You are now able to change the page’s settings as well as modifying elements displayed on this page. Go to create a dashboard element for more information on how to add dashboard elements to your page.
 - Save your changes by clicking the
 button.
 - To return to the list of available dashboard pages click the button.
Delete a Dashboard Page
- To permanently delete a page, access the list of existing pages as detailed above.
- In the list of available pages, use the icon in the right-most column to permanently delete the page.
Warning
Be careful when deleting pages or elements. Deleting dashboard pages will permanently delete the page including sub-pages. This action cannot be undone.
Create a Dashboard Element
This section covers the steps required to add a new element to an existing dashboard page. If you would like to extend your dashboard by adding additional pages, please see create a dashboard page for further information.
- To modify an existing page, access the list of existing pages as outlined in the previous section.
- Click the icon next to the page’s name. This will open the page’s settings.
- On the right side of the page you should see a list of available dashboard elements. Above this list, you have three buttons
 . Select the type of element you would like to add by clicking the corresponding button.
- You should now see a page similar to the one displayed below.
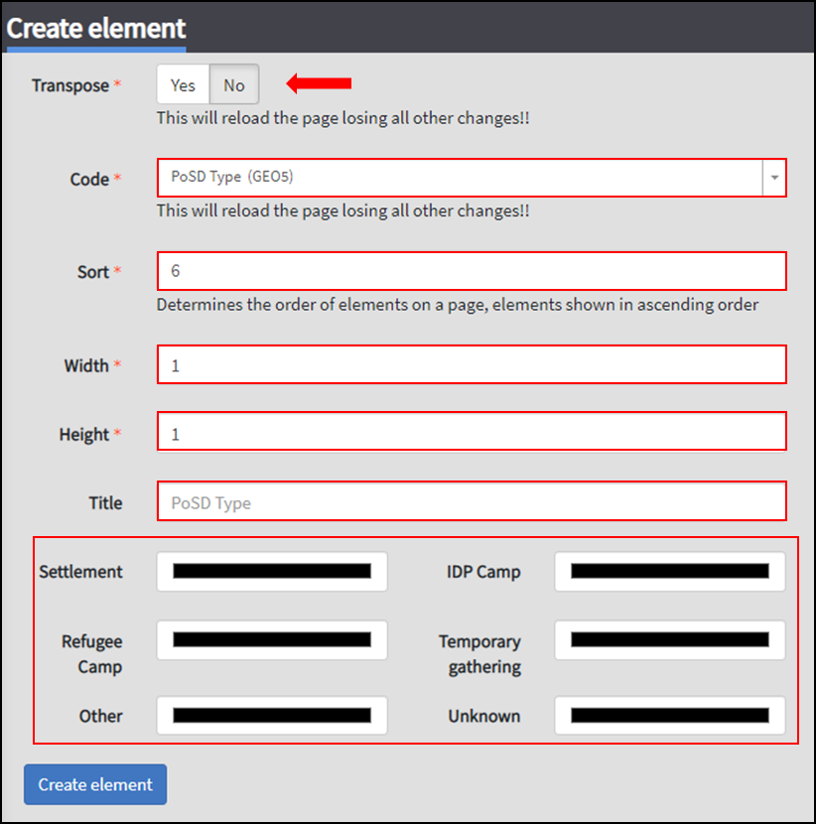
- The Transpose feature allows switching between aggregating data at the health facility and the health service level. Set the feature to No to display data aggregated at the health facility level.
Tip
Transposing the element or changing the question code or will reload the page making you lose all other unsaved edits.
- Select the question to be displayed using the Code dropdown list.
- Define the element position on the dashboard page by specifying the Sort index. Increment the index by 1 for each new item, starting with 0 for the first page.
- The Width and Height fields allow creating custom-sized elements.
Tip
For charts with large legend elements, it is recommended to use a Width of 2 to assure the legend is displayed correctly.
- Optionally, the Title field allows you to overwrite the default title of the element.
- For maps and charts, the bottom half of the page, displays the list of pre-defined answer options of the selected question. Click the color next to the category name. This will opens a color picker allowing you to pick custom colors. For maps, you can further specify the size of the dots by increasing/decreasing the Marker Radius.
- For tables, two additional fields will be displayed to specify the Reason Code and Group Code.
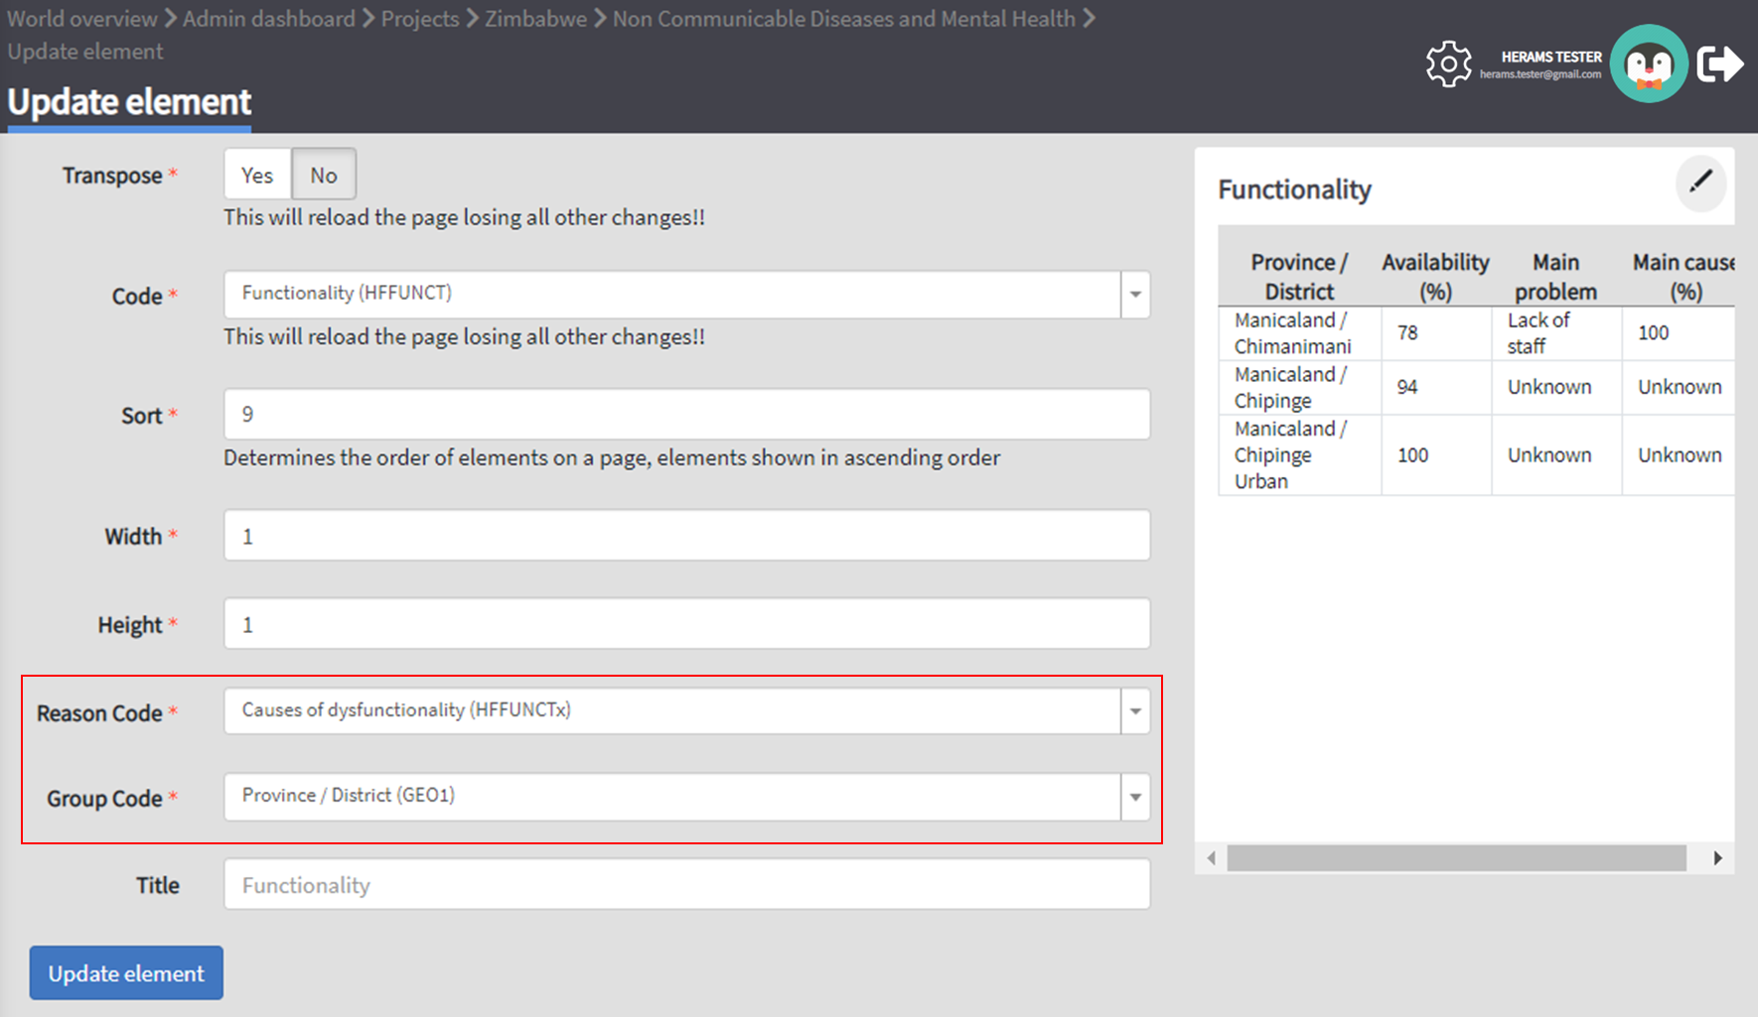
- A preview of the element you are creating is shown in the lower half of the page.
- To save the element, click the
 button or use the
  button save and return to the dashboard.
 - To add additional elements, use the breadcrumbs to return to the
The below video summarizes how to create a new dashboard page and add elements.
Modify Dashboard Elements
Users with the permissions to edit dashboards can modify charts and maps directly from within the dashboard.
Tip
To modify the order of dashboard pages or rename a page, see here.
Open the dashboard and navigate to the element you would like to change.
In the top right corner of the element you would like to change, you should see a
icon. Right-click the icon to open the element’s configuration page.You should now be able:
- to change the variables displayed;
- to change the colors of a map or a chart; and
- to rename the element.
- Save your changes by clicking the
 button.
Delete Dashboard Elements
- Access the list of existing dashboard elements as described here.
- In the bottom half of the page you will see a list of all available dashboard pages. Click the icon to open the page you would like to modify.
- In the lower half of the page you will see a list of all elements displayed on the dashboard page. Use the to permanently delete the element.
Warning
Be careful when deleting dashboard elements. Deleted elements cannot be restored.
FAQ
This section aims to help users troubleshoot frequently encountered issues. In case you encounter an issue that is not addressed here, please contact your country administrator or send an email to hearms@who.int.
General
Confirmation email not received
If you did not receive an email upon registering or resetting your password, follow the steps below to troubleshoot the issue.
- Refresh your inbox. It might take a few minutes for the email to appear.
- Check your spam/junk folder.
- Try to register again. You might have accidentally misspelled your email.
- If the above steps did not solve your issue, please contact your system administrator or send an email to hearms@who.int.
View a project/dashboard
Can’t access a project dashboard
For data protection reasons, access to the project dashboards is only granted upon request. If you require access to a project, please contact your country focal point or send an email to hearms@who.int, specifying why you require access to the project.
Who has access to your project/workspace?
In-country administrators and users responsible for a project or workspace can verify the list of users having access to the project and/or workspace as well as their permission levels. See Add a user for more information on granting users access to a Project or Workspace.
Data editing & downloading
Data updates don’t appear on the dashboard
It is important to note that the data displayed on the interactive dashboards are only synchronized every 30 minutes. Thus, is it is possible that updates to the data don’t show immediately on the dashboards. To solve the issue, manually sync the data cache of the workspace. For more information on data caching read the section on Icons and their Meaning.
Exported data is unreadable / contains strange characters
If you open data downloaded from HeRAMS in Excel, you might experience an issue with special characters not displaying correctly, resulting in unreadable text. For example, instead of camp de réfugiés you get Camp de réfugiés. The reason for this is that Excel is not using the correct encoding type to read your data. To correct the issue, follow the instructions outlined here.
Testing hosted weblate translations.